- Bitcoin price stalls under $9,000 in spite of the halving but the technical picture remains positive.
- The ascending channel support has been key to the recovery trend from March lows under $4,000.
Bitcoin price has experienced significant weakness following the massive drop during the weekend session. The pre-halving dumping caught many traders off guard as the industry expected Bitcoin to sustain gains above $10,000 pre and post-halving. While recovery from the May lows at $8,015 ensued in the wake of the fall, Bitcoin failed to hold above $9,000 owing to the selling pressure at $9,200.
At the time of writing, BTC/USD is trading at $8,735 after adjusting 1.91% up from the opening value at $8,571. Bitcoin’s immediate downside is supported by an ascending channel whose support has continued to function incredibly since the March crash under $4,000. If push comes to shove and BTC resumes the downtrend, of key interest would be $8,400 (confirmed), $8,100 (weekend support), the 200-day SMA ($8,000) and 50-day SMA currently at $7,566.
From a technical perspective, Bitcoin is back in a bullish phase. The RSI is pointing north after holding above the average during the drop. For the buyers, gains above $8,800 and $9,000 will go a long way in paving the way to higher levels at $9,500 and $10,000. Besides, the incoming golden cross pattern could be the key for Bitcoin surge above $10,000.
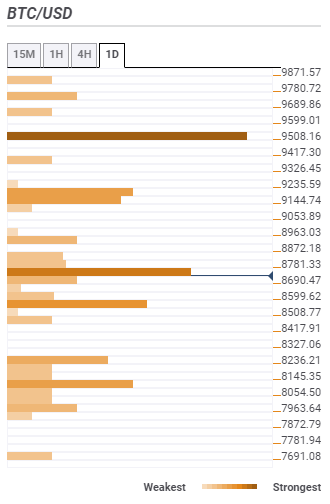
Bitcoin confluence resistance and support areas
Resistance one: $8,781 – Is a zone that brings together the SMA 5 15-minutes, the previous high 4-hour, the Bollinger Band 15-mins upper curve and the previous high 15-mins.
Resistance two: $9,235 – Highlighted by the SMA 100 1-hour, SMA 50 4-hour and the previous high one-day.
Resistance three: $9,508 – Is home to the previous month high and the Fibonacci 38.2% one-week.
Support one: $8,599 – Highlighted by the Fibo 38.2% one-day and the Bollinger band 15-mins.
Support two: $8,145 – Is a buyer congestion zone highlighting the pivot point one-day support one and the Bollinger Band 4-hour.