- XRP/USD bulls cannot clear $0.2000 protected by selling orders.
- Strong support is created at $0.1760, which is the lowest level of the previous year.
XRP price stays below $0,2000 after a failed attempt to clear this pivotal barrier. The third-largest digital coin hit the intraday high at $0,2001 before fresh selling interest pushed the price towards $0,1980. XRP/USD has stayed mostly unchanged on a day-to-day basis and gained nearly 3% since the beginning of Tuesday.
The intraday chart shows that the RSI points upwards though it is still below 70 (overbought zone). It means that the coin may resume the recovery attempts in the nearest future.
XRP/USD 1-hour chart
-637248914951104994.png)
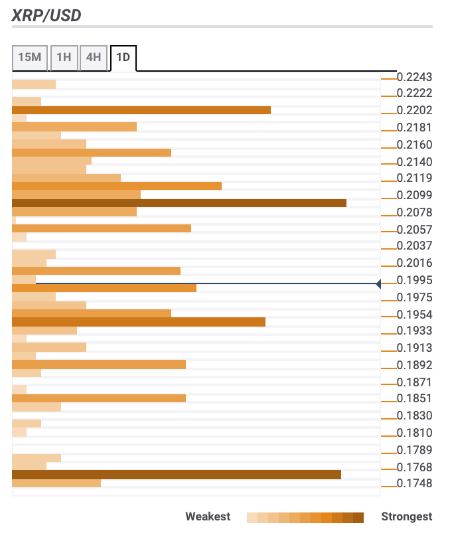
Let’s have a closer look at support and resistance levels clustered around the current price.
Resistance levels
$0,2050 – psychological level, 1-hour SMA100
$0,2100 – the middle line of the daily Bollinger Band, daily SMA5, Pivot point 1 day Resistance 2, Pivot point 1-week Support 1
$0,2200 – 61.8% Fibo retracement weekly, 23.6% Fibo retracement monthly.
Support levels
$0,1950 – 61.8% Fibo retracement monthly and daily
$0,1900 – 23.6% Fibo retracement daily
$0,17600 – Pivot Point 1-month Support 1, the lowest level of the previous year.