- Bitcoin price extends recovery above $8,900 but falls short of $9,000.
- It is apparent that gains above $9,000 would clear the way to deal with the resistance at $9,532.
Bitcoin bulls are finally waking up from their hiding after a gruesome four days. The largest cryptocurrency has struggled with recovery from the weekend lows at $8,100. However, at the momentum progress has been made towards $9,000 after the seller congestion zone at $8,900 was cleared. At the time of writing, BTC/USD is trading at $8,910 following a minor adjustment from an intraday high of $8,979.
Meanwhile, the daily chart shows Bitcoin displaying a very encouraging picture with the bounce from the ascending channel support. The RSI is also pointing upwards after finding support at 50 (average level). It is apparent that if the resistance at $9,000 and $9,200 are cleared, Bitcoin could have a clear path beyond $9,500.
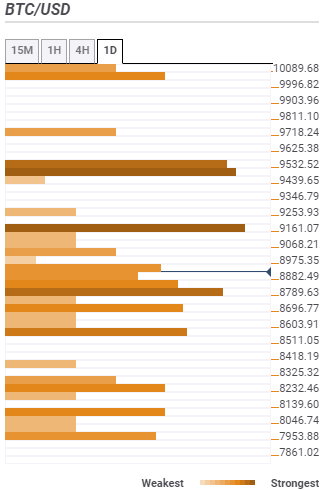
Bitcoin price confluence support and resistance levels
The confluence tool shows that Bitcoin is facing a tough resistance at $8,975 which continues to hold it back from the pivotal $9,000 level. This region is home to the SMA five 15-minutes, SMA ten 15-minutes, the previous high 15-minutes, and the SMA 100 one-hour. Following a break above $9,000, the bulls will have to prepare well to overcome the significant hurdle at $9,161 as highlighted by the Fibonacci 61.8% one-week, SMA 50 4-hour, and SMA 200 1-hour. Further up, the rest of the journey to $10,000 will be obliged to deal with the pressure at $9,532.
On the downside, support is in plenty with the first at $8,882 as emphasized by the previous high 4-hour, Fibo 23.6% one-day and the SMA 15-mins. Key support lies with $8,789 and is home to the Bollinger Band 15-mins lower, SMA 200 15-mins, and SMA 50 1-hour. Other areas of interest to the buyers include $8,696, $8,603, and $8,232.