- REP/USD is trading just above $18 again after an $18.52 high on June 19.
- Augur is inside a robust daily uptrend.
Augur is in a clear and strong uptrend and is not facing many resistance levels. REP/USD is up 224% since its 2020-low in March. The overall trading volume for Augur has been increasing significantly in 2020 compared to previous years. Augur was barely seeing $10 million in trading volume in 2019, now it’s hitting $30 million on average.
REP/USD daily chart
-637281966870637834.png)
Not much to say about this chart as bulls are clearly dominating even when the RSI is overbought. If there is a pullback, buyers will look for the 12-EMA support at $15.77 but anything above $13.59 is simply a higher low and a continuation of the daily uptrend.
REP/USD 4-hour chart
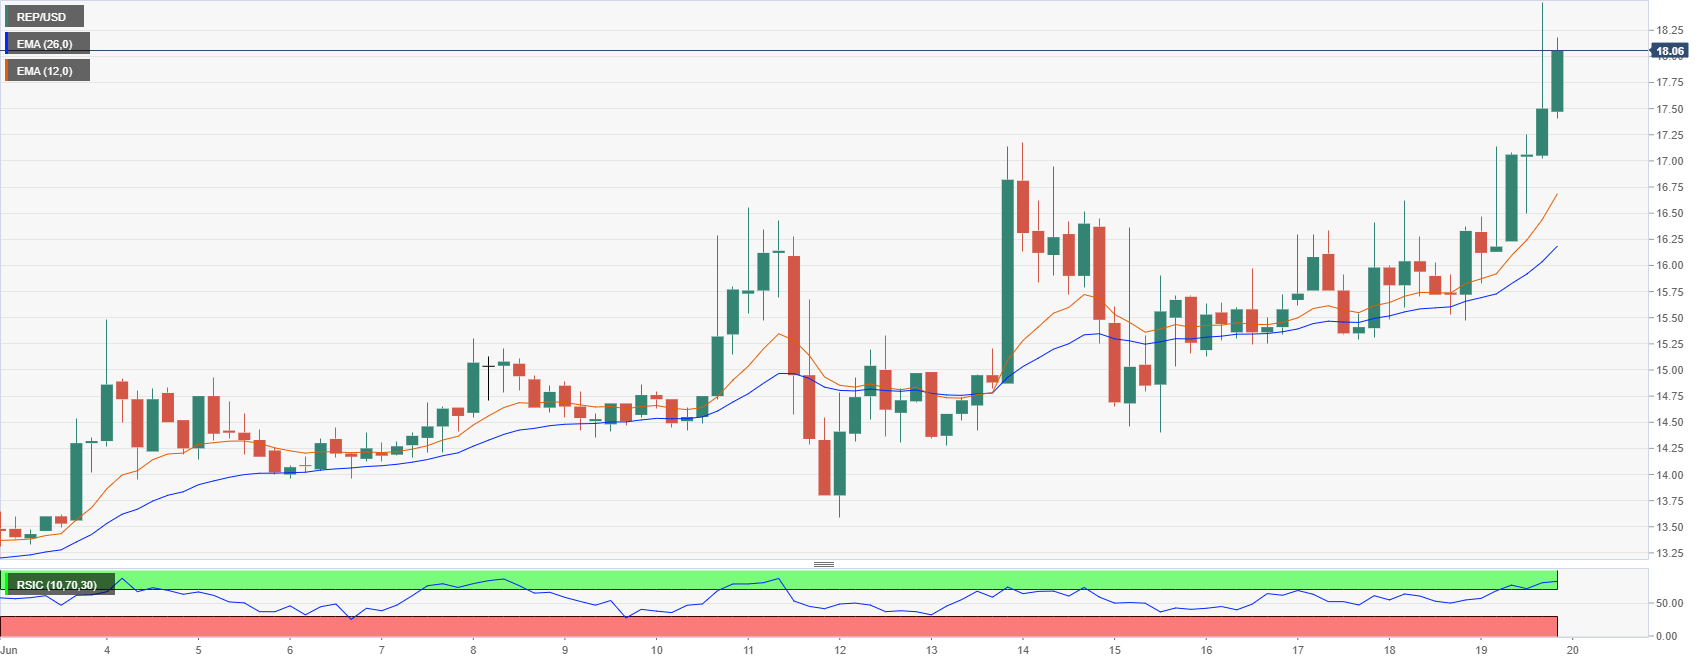
The 10% bull move happened over the course of 20 hours which indicates it’s a strong move and a lot of buyers are jumping in. The RSI is also overextended here and healthy consolidation could follow next. Again, support is around the 12-EMA at $16.19 but even here, anything above $15.47 is a higher low and the uptrend would remain intact.
