- IOT/USD bulls managed to break the $0.23 price barrier.
- The SMA 20 curve acts as immediate market resistance.
- The Elliott Oscillator has had a green session, following 11 straight red sessions.
IOT/USD daily chart
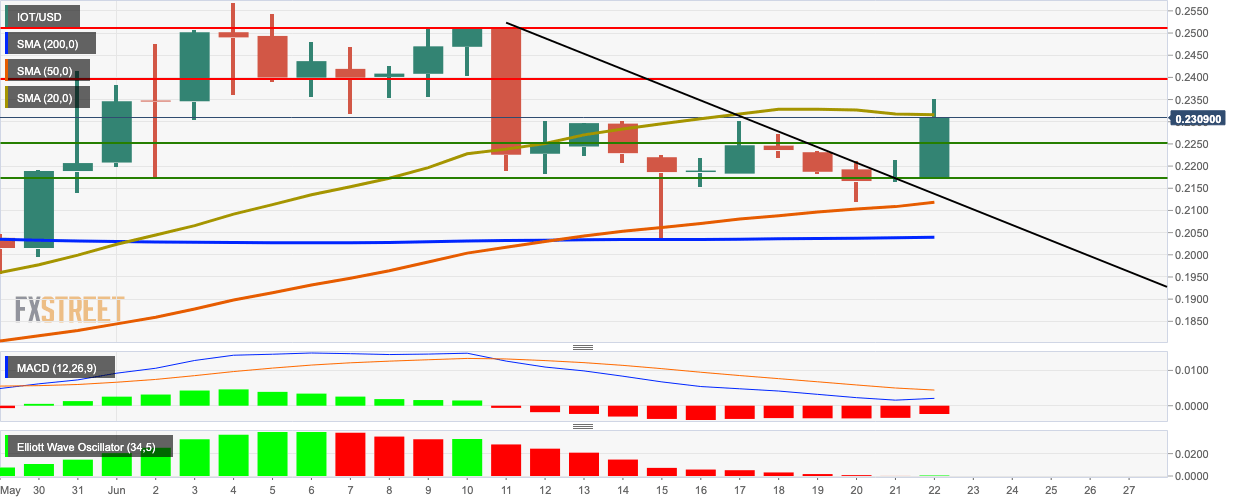
IOT/USD jumps from $0.217 to $0.231 as the bulls took charge broke past the $0.22 and $0.23 psychological levels. The MACD shows decreasing bearish market momentum, while the Elliott Oscillator has had a green session after 11 straight red sessions.
Support and Resistance
The SMA 20 curve acts as immediate market resistance. Up ahead, strong resistance levels lie at $0.24 and $0.25. On the downside, healthy support levels lie at $0.225, $0.217, SMA 50 and SMA 200.
Key levels
