- Ethereum is down 3.7% on a weekly basis.
- $230 aligns as the next technical support for ETH/USD.
Ethereum (ETH/USD) made a technical correction on Saturday and gained 1.3% to snap a three-day losing streak. However, the pair’s recovery lost its stream on Sunday and ETH/USD was last seen losing 0.8% on the day at $234. On a weekly basis, Ethereum is down 3.7%.
ETH/USD technical outlook
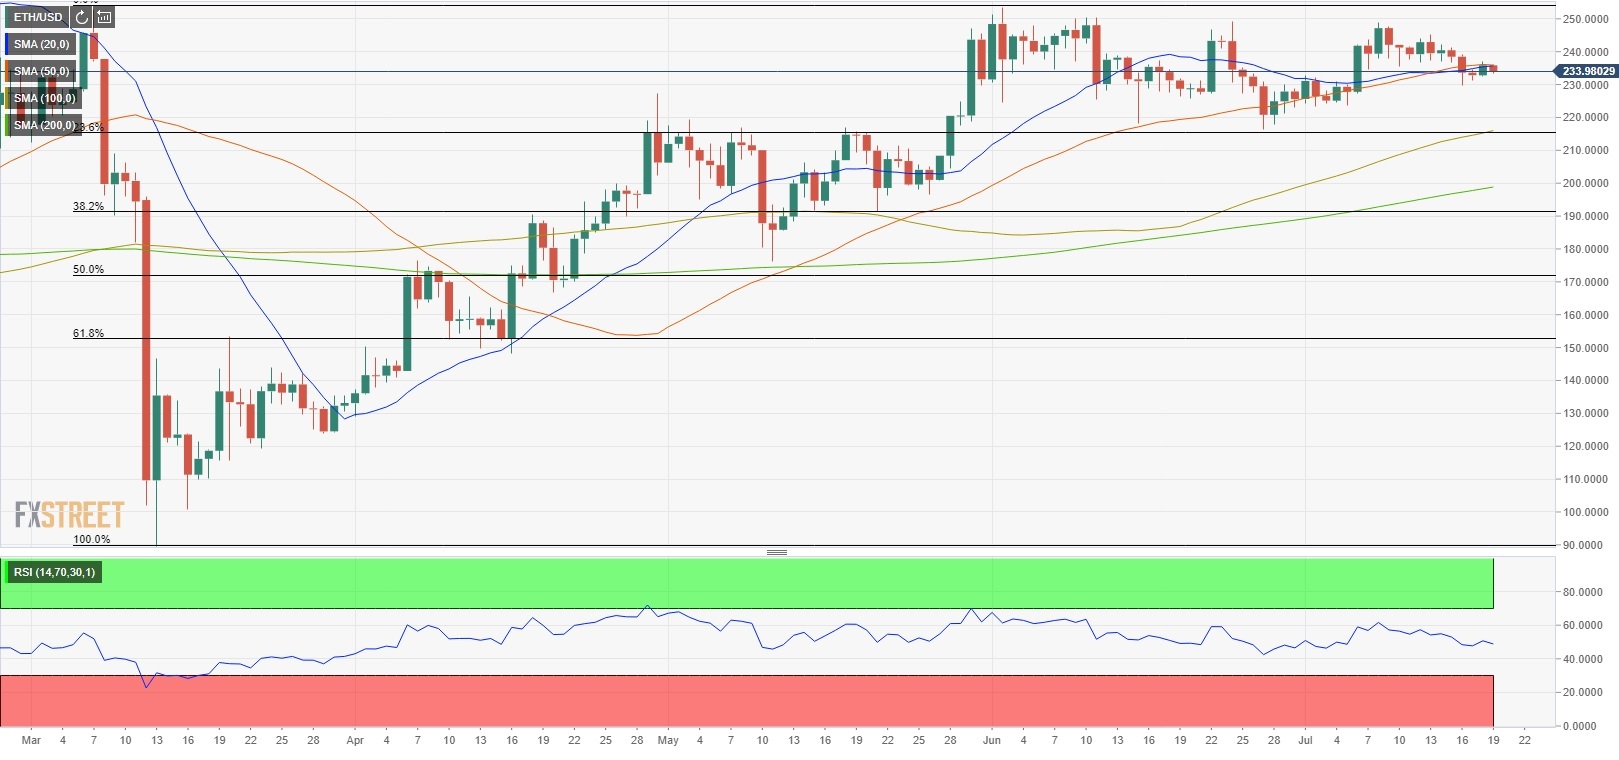
Despite the rebound witnessed on Saturday, Ethereum struggled to clear the 20-day and the 50-day SMAs and trades below those lines on Sunday. Meanwhile, the RSI indicator on the daily chart started to edge lower below 50, suggesting that buyers are not interested in a more decisive recovery.
The immediate support for ETH/USD aligns at $230 (Jul. 16 low) ahead of $225 (static level) and critical $215 (100-day SMA/Fibonacci 23.6% retracement of March-June rally). Resistances, on the other hand, could be seen at $240 (20-day SMA/50-day SMA), $250 (static level) and $255 (Jun. 2 high).
Ethereum chart (daily)