- Bitcoin sees chart-driven sharp selling on Saturday.
- Bears return amid a rising wedge breakdown on the hourly chart.
- Healthy support awaits at $11420 levels, with bearish RSI.
Bitcoin (BTC/USD) sellers return with pomp and show this Saturday, breaking the consolidation seen around $11550. The most favorite crypto coin reverses a part of Friday’s rebound, having faced rejection just shy of the $11,600 mark. Bitcoin posts small losses to trade around 11,460, at the press time. The market capitalization of the No.1 digital asset stands at $212.57 billion.
Technical Overview
BTC/USD: Hourly chart
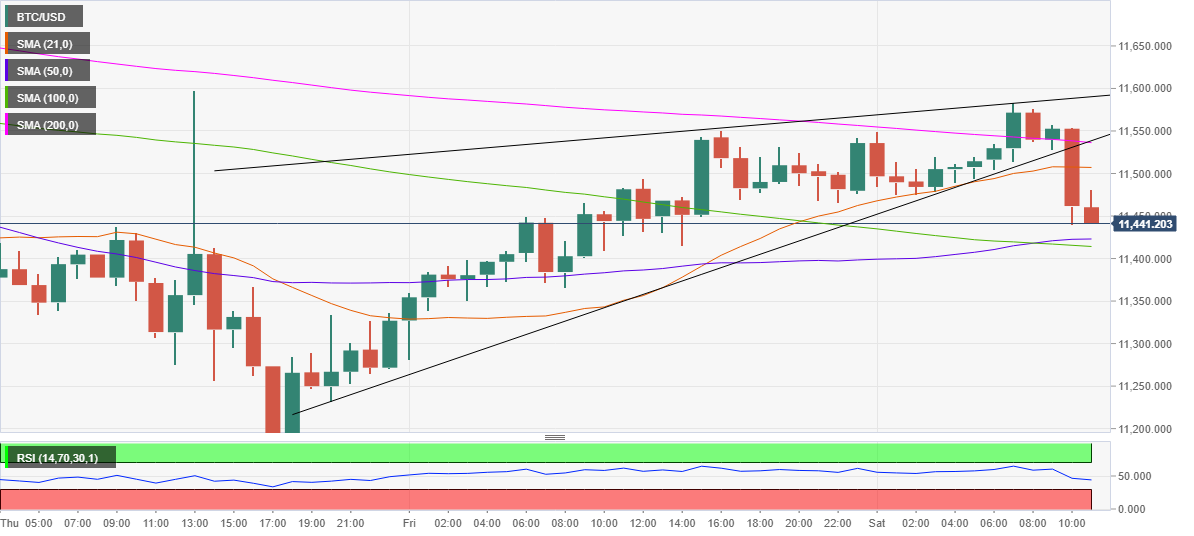
As observed in the hourly chart, BTC/USD has charted a rising wedge breakdown in the last hour following a break below the critical cushion at $11,535/530, the confluence of the rising trendline support and 200-hourly Simple Moving Average (HMA).
Selling pressure intensifying on the bearish break, as the price pierced through the 21-HMA support at $11,507, falling as low as $11,440.
Despite the quick drop, the bulls managed to stay above the next powerful support at $11,420, which is the convergence of the horizontal 50 and 100-HMAs.
A break below the latter will call for a test of the pattern target sub-$11,200 levels.
Meanwhile, any pullbacks will meet initial resistance at the 21-HMA, the previous support.
Acceptance above that level, the bulls will look to reclaim the fierce $11,535 cap. The path of least resistance, however, appears to the downside, as the Relative Strength Index (RSI) remains in the bearish region, at 44.20, pointing to additional losses.
BTC/USD: Additional levels to watch
