- XRP/USD has had two straight bullish sessions.
- The Elliott Oscillator has had 12 straight red sessions, dropping from 0.048 to -0.0115.
XRP/USD daily chart
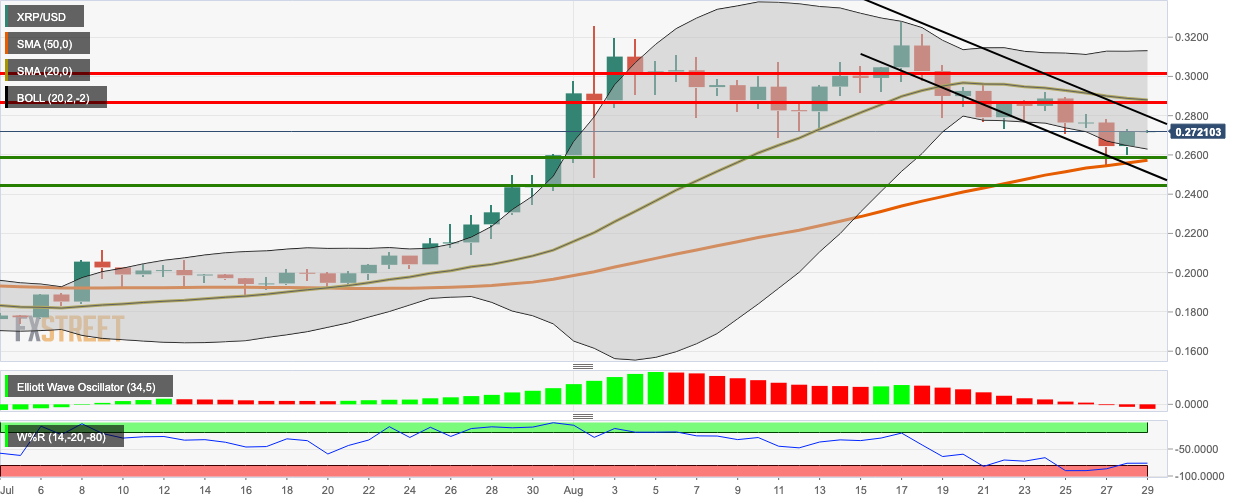
XRP/USD bulls retained control of the market as the price went up from $0.2645 to $0.2721 in the early hours of Saturday. The price is trending in a downward channel formation and hovering inside the lower half of the 20-day Bollinger Band. The Elliott Oscillator has had 12 straight red sessions, dropping from 0.048 to -0.0115. This indicates that the overall market sentiment is still bearish.
William’s %R has crept out of the oversold zone and is currently trending around -74. XRP/USD daily chart has strong resistance levels at $0.2864 (SMA 20) and $0.3017. On the downside, we have two healthy support levels at $0.2589 (SMA 50) and $0.2447.
Key levels
