- BTC/USD regain control and push the price towards the critical resistance zone.
- The price may retrace inside the Bollinger Band on 1-hour chart.
Bitcoin (BTC) hit the intraday high at $11,944 and retreated to $11,920 by the time of writing. The first digital asset has recovered from the recent bottom of $11,227 hit on August 27 and aimed at $12,000, which is regarded as a critical psychological barrier. BTC/USD has gained over 2% both on a day-to-day basis and since the beginning of the day.
BTC/USD 1-hour chart
-637345441989052067.png)
On the intraday charts, BTC/USD jumped above the upper line of the 1-hour Bollinger Band, which now serves as a local support at $11,850. The price may return inside the Bollinger Band within the technical correction with the next focus on 1-hour SMA50 at $11,660. The RSI on the intraday stays flat on the overbought territory, which is a potential signal for the bearish correction.
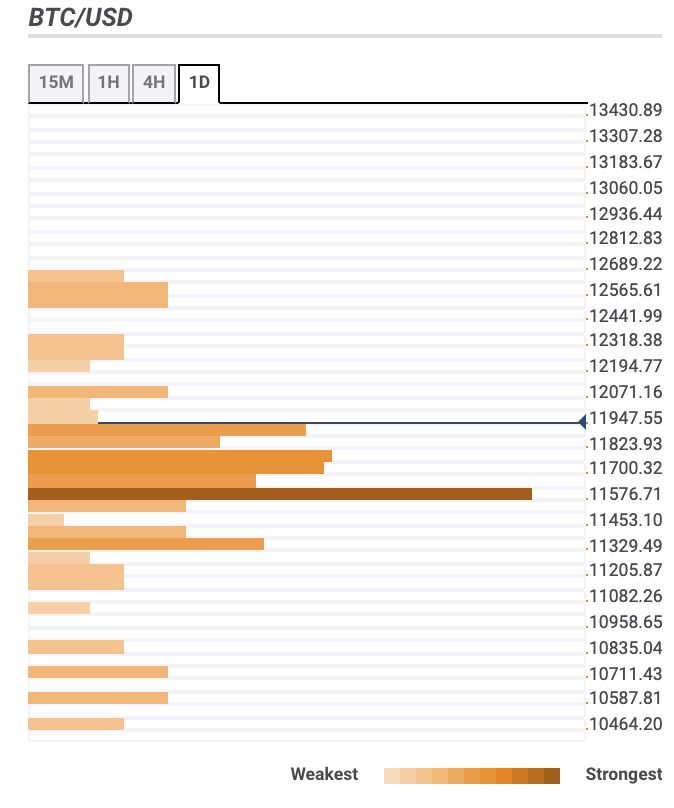
Bitcoin confluence levels
The majority of technical barriers are clustered both below the current price, which means the price may be better positioned for further recovery. Let’s have a closer look at support and resistance levels for BTC/USD.
Resistance levels
$12,000 – 23.6% Fibo retracement monthly
$12,300 – Pivot Point 1-week Resistance 2
$12,500 – the highest level of the previous month
Support levels
$11,700 – 61.8% Fibo retracement daily, the middle line of the 1-hour Bollinger Band, 38.2% Fibo retracement monthly
$11,500 – 1-hour SMA200, 4-hour SMA50, 61.8% Fibo retracement weekly
$11,000 – daily SMA50
BTC/USD, 1-day