- Bitcoin Cash has dropped down after bulls ran out steam near the $260 resistance level.
- The whales have been quietly accumulating more tokens, which is a positive sign.
Bitcoin Cash enjoyed a bullish upswing between October 7 and October 15, wherein the price went up from $220 to $262. After encountering heavy resistance, the peer-to-peer electronic cash has plummeted to $249.50. In the process, it has managed to drop below the 100-day and 200-day SMAs. The price had since recovered above the latter.
BCH/USD daily chart
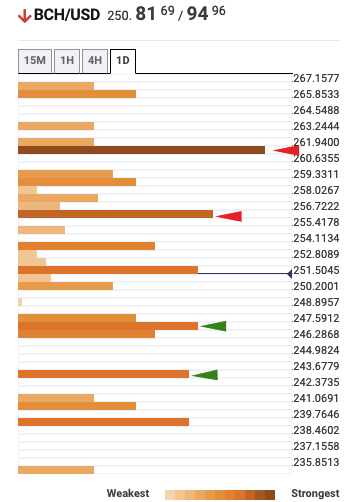
The daily confluence detector well defines these strong resistance lines for BCH. The confluence detector is a handy tool that helps us visualize strong resistance and support levels. The 100-day SMA coincides with the strong resistance, as shown by the detector. If the price breaks below the 200-day SMA and $242 support line, the next healthy support lies at the 50-day SMA ($235).
BCH confluence detector
The Flipside: Can the BCH bulls launch a fightback?
The bulls can launch a fightback if they manage to flip 100-day SMA from resistance to support. If they do that, they will gain enough momentum to conquer the $262 resistance line, as well. The bulls will be encouraged by the whales’ actions, who have been on a buying spree. As per Santiment, the number of addresses holding 10,000-100,000 BCH went up from 167 on October 14 to 169 on October 16.
BCH holders distribution
Key price levels to watch
The bears can stay in control if they regain the 200-day SMA ($245) and flip it from support to resistance. Following that, the sellers will look to conquer the $242 support line. The downside can be capped at the 50-day SMA ($235).
The bulls will need to flip the 100-day SMA ($255) from resistance to support and aim for the $262 resistance line. If this level is conquered, Bitcoin Cash should be able to reach the $290 resistance barrier.
-637384909590261555.png)

%20%5B05.24.02,%2017%20Oct,%202020%5D-637384910388285389.png)
