- The $11,600 resistance line has proven to be a substantial barrier for the bulls.
- The 100-day SMA has crossed over the 50-day SMA to chart the bearish cross pattern.
After finding support at the 100-day SMA, Bitcoin jumped up from $10,600 to $11,500 between October 7 and October 12. Since then, the premier cryptocurrency has been trending horizontally after facing repeated rejections at the $11,600 resistance line. The premier cryptocurrency has since dropped to $11,350.
BTC/USD daily chart
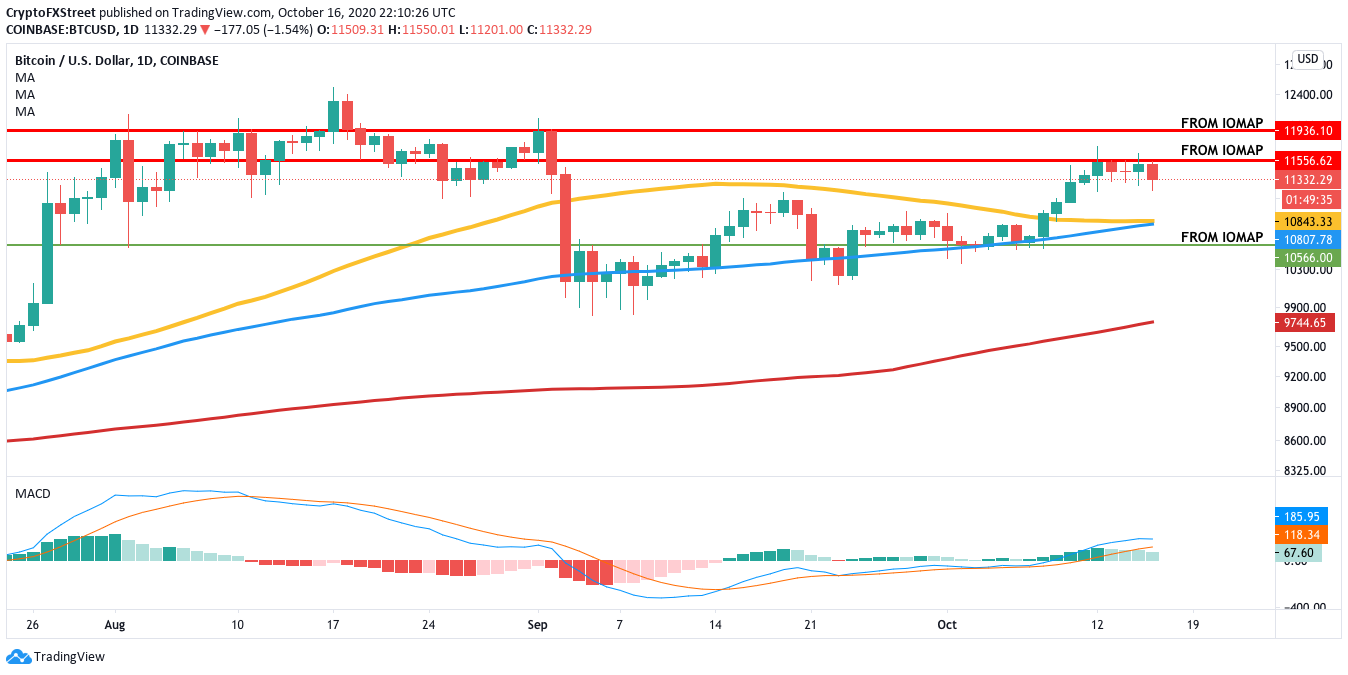
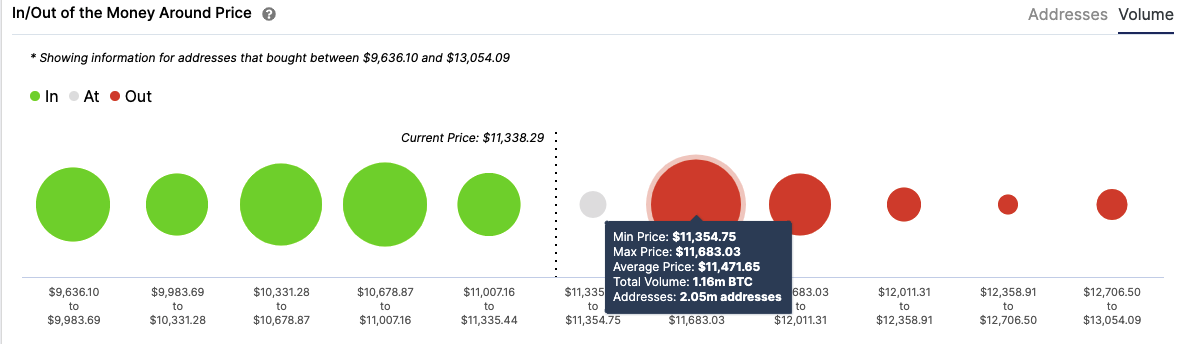
The 100-day SMA has crossed above the 50-day SMA to chart a bearish cross pattern. BTC will probably drop till the point of intersection, which coincides with the $10,825 support wall. At this level, 1.4 million addresses had previously purchased 960,000 BTC. A break below this level will take the price down to the $10,500 and a further break will plummet the price down to the 200-day SMA ($9,700).
BTC IOMAP
The whales are contributing majorly to the bearish pressure by dumping their holdings. The number of addresses holding 1,000-10,000 BTC has dropped from 2,082 on October 13 to 2,078 on October 16. Similarly, the number of addresses holding 10,000-100,000 BTC dropped from 109 on October 12 to 104 on October 16.
BTC holders distribution
%20%5B03.41.11,%2017%20Oct,%202020%5D-637384859887032688.png)
The Flipside: How can the bulls salvage this?
The bulls can still salvage the situation if they regain momentum and break past the $11,600 resistance line. Following that, the IOMAP tells us that there is a moderate-to-strong resistance barrier at $11,850. If the buyers somehow manage to break past these levels, they will push the price to $13,000.
Key price levels to watch
The bears will look to drop the price to the 50-day and 100-day SMA intersection at $10,825. A further drop will see BTC go down to the $10,500 support line. These two walls are strong enough to absorb a large amount of selling pressure.
The bulls will need to first break past the $11,600 obstacle. If they somehow manage to do that, the next notable resistance they face is at $11,850.
