- YFI is bounded inside a descending triangle pattern.
- Bulls need to hold critical support level at $13,000 to avoid a significant pullback.
Despite the bullish momentum of the entire crypto market, it seems that YFI hasn’t benefited from it, being down 16% since October 24. The digital asset is currently trading at $13,153 and shows almost no signs of recovery.
Slipping below $13,000 can drive YFI towards $8,600
The lower trendline at $13,000 of the descending triangle pattern formed on the 4-hour chart has acted as strong support several times in the past since October 8. A break down below that level would be significant for the bears.
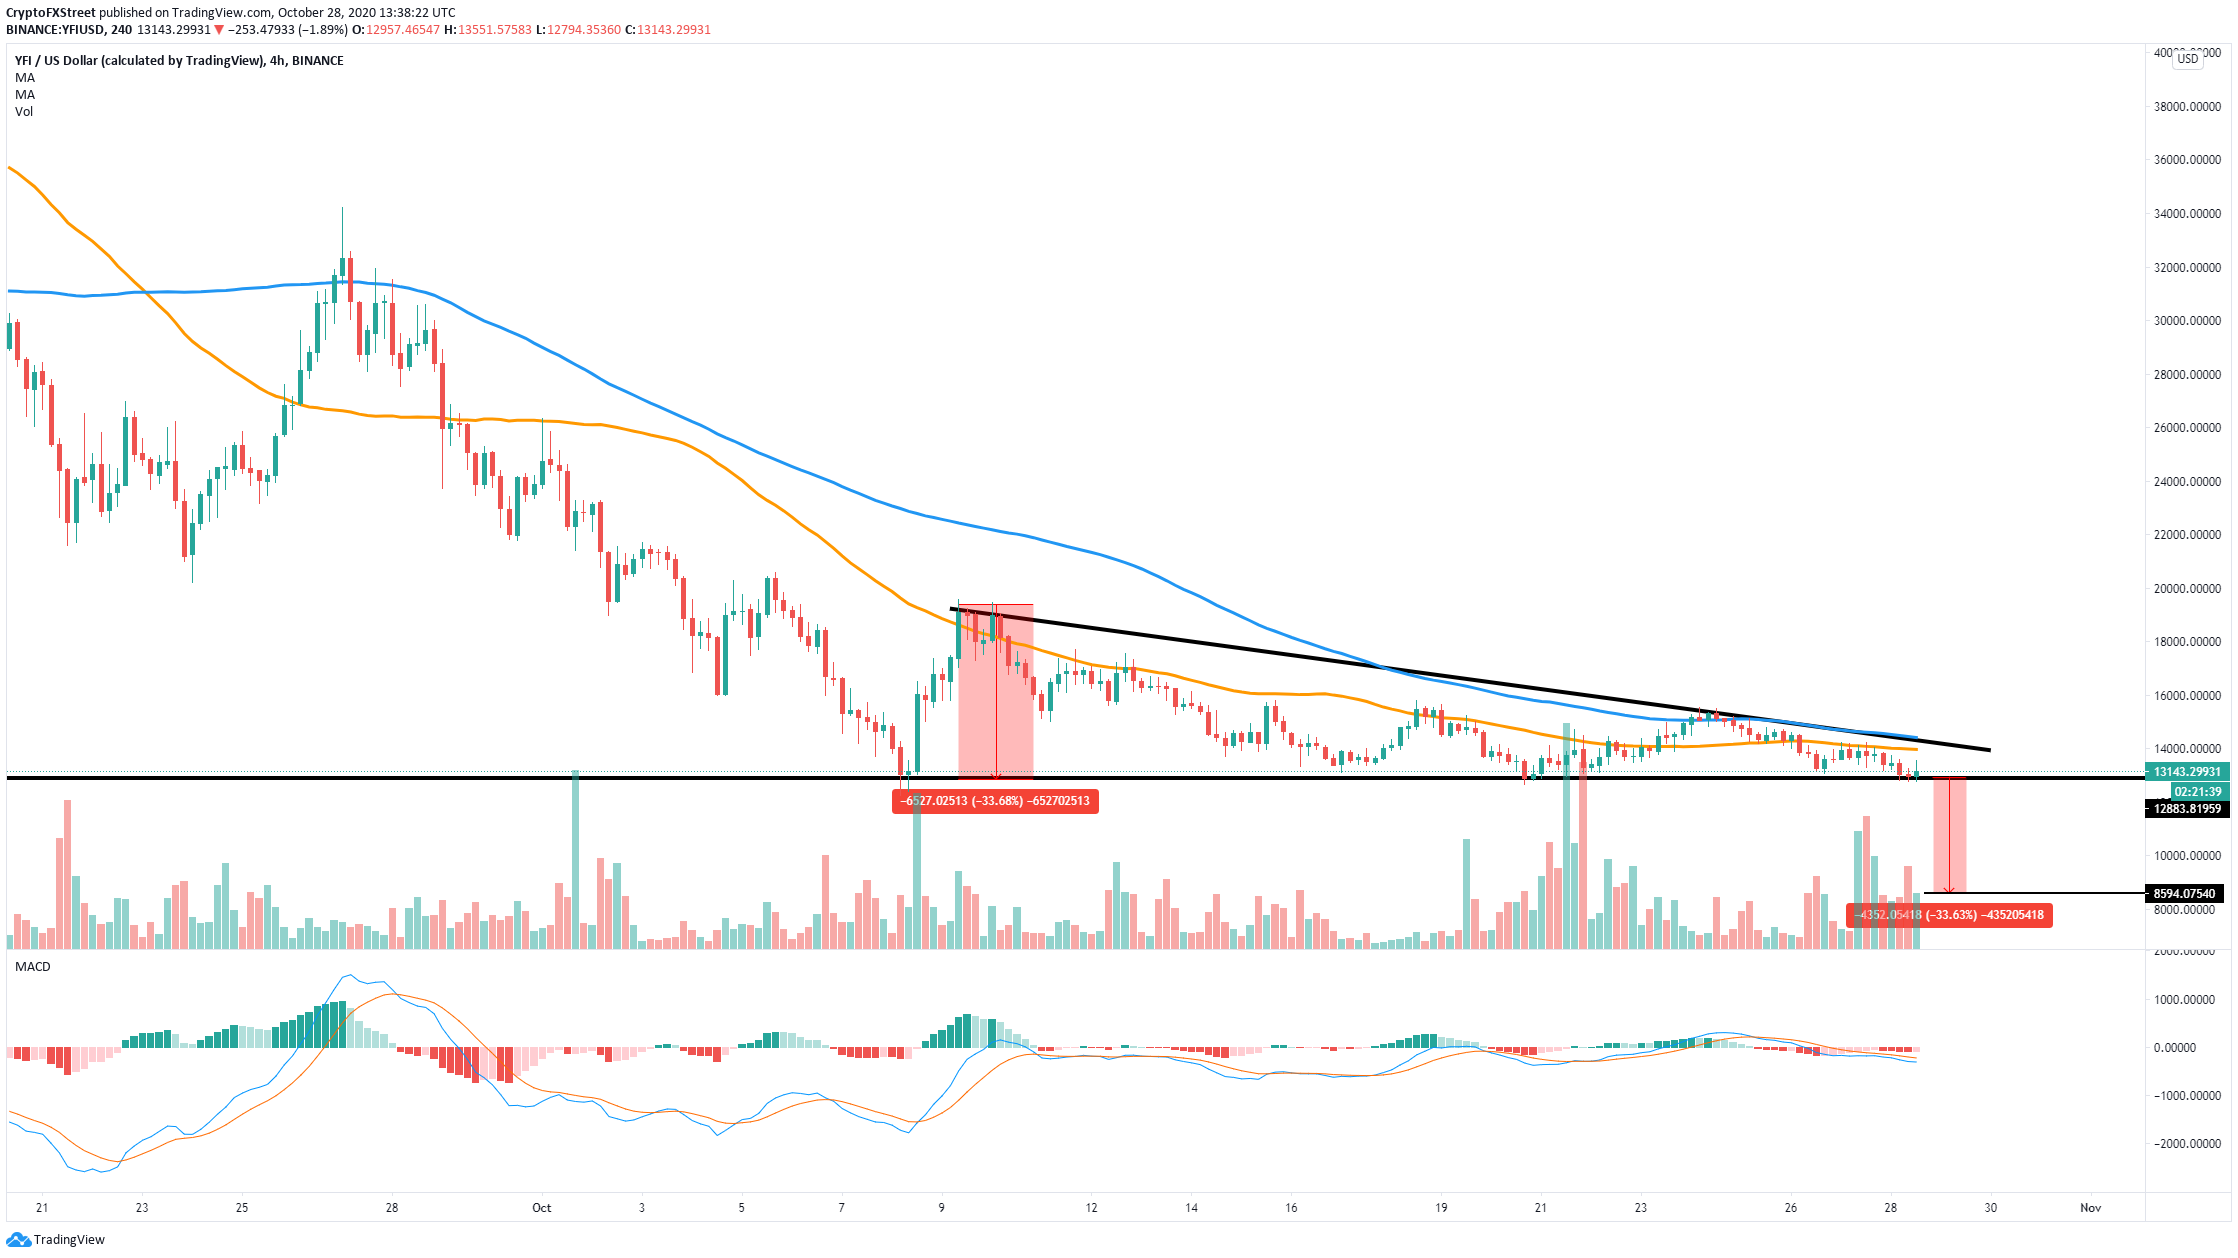
YFI/USDT 4-hour chart
The MACD remains bearish and started to gain momentum again. The length from the top of the triangle to the lower trendline can be used as a price target for the bears. In this case, it seems that YFI could drop as far as $8,600.
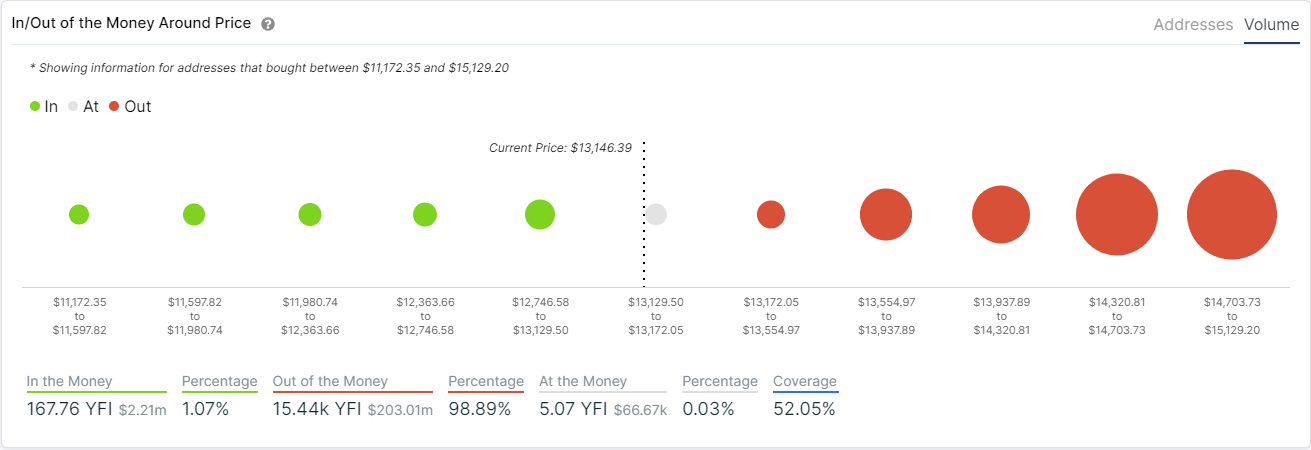
YFI IOMAP chart
Furthermore, the In/Out of the Money Around Price shows very little support on the way down from $13,129 until $11,172. In comparison, resistance is far more substantial as a higher number of investors bought additional YFI tokens on the way up.
A positive sign for YFI bulls
On the other hand, it seems that the TD Sequential indicator is about to present a strong buy signal on the 12-hour chart. Successfully defending the robust support trendline of the descending triangle pattern could drive the price of YFI towards the upper resistance at $14,100.
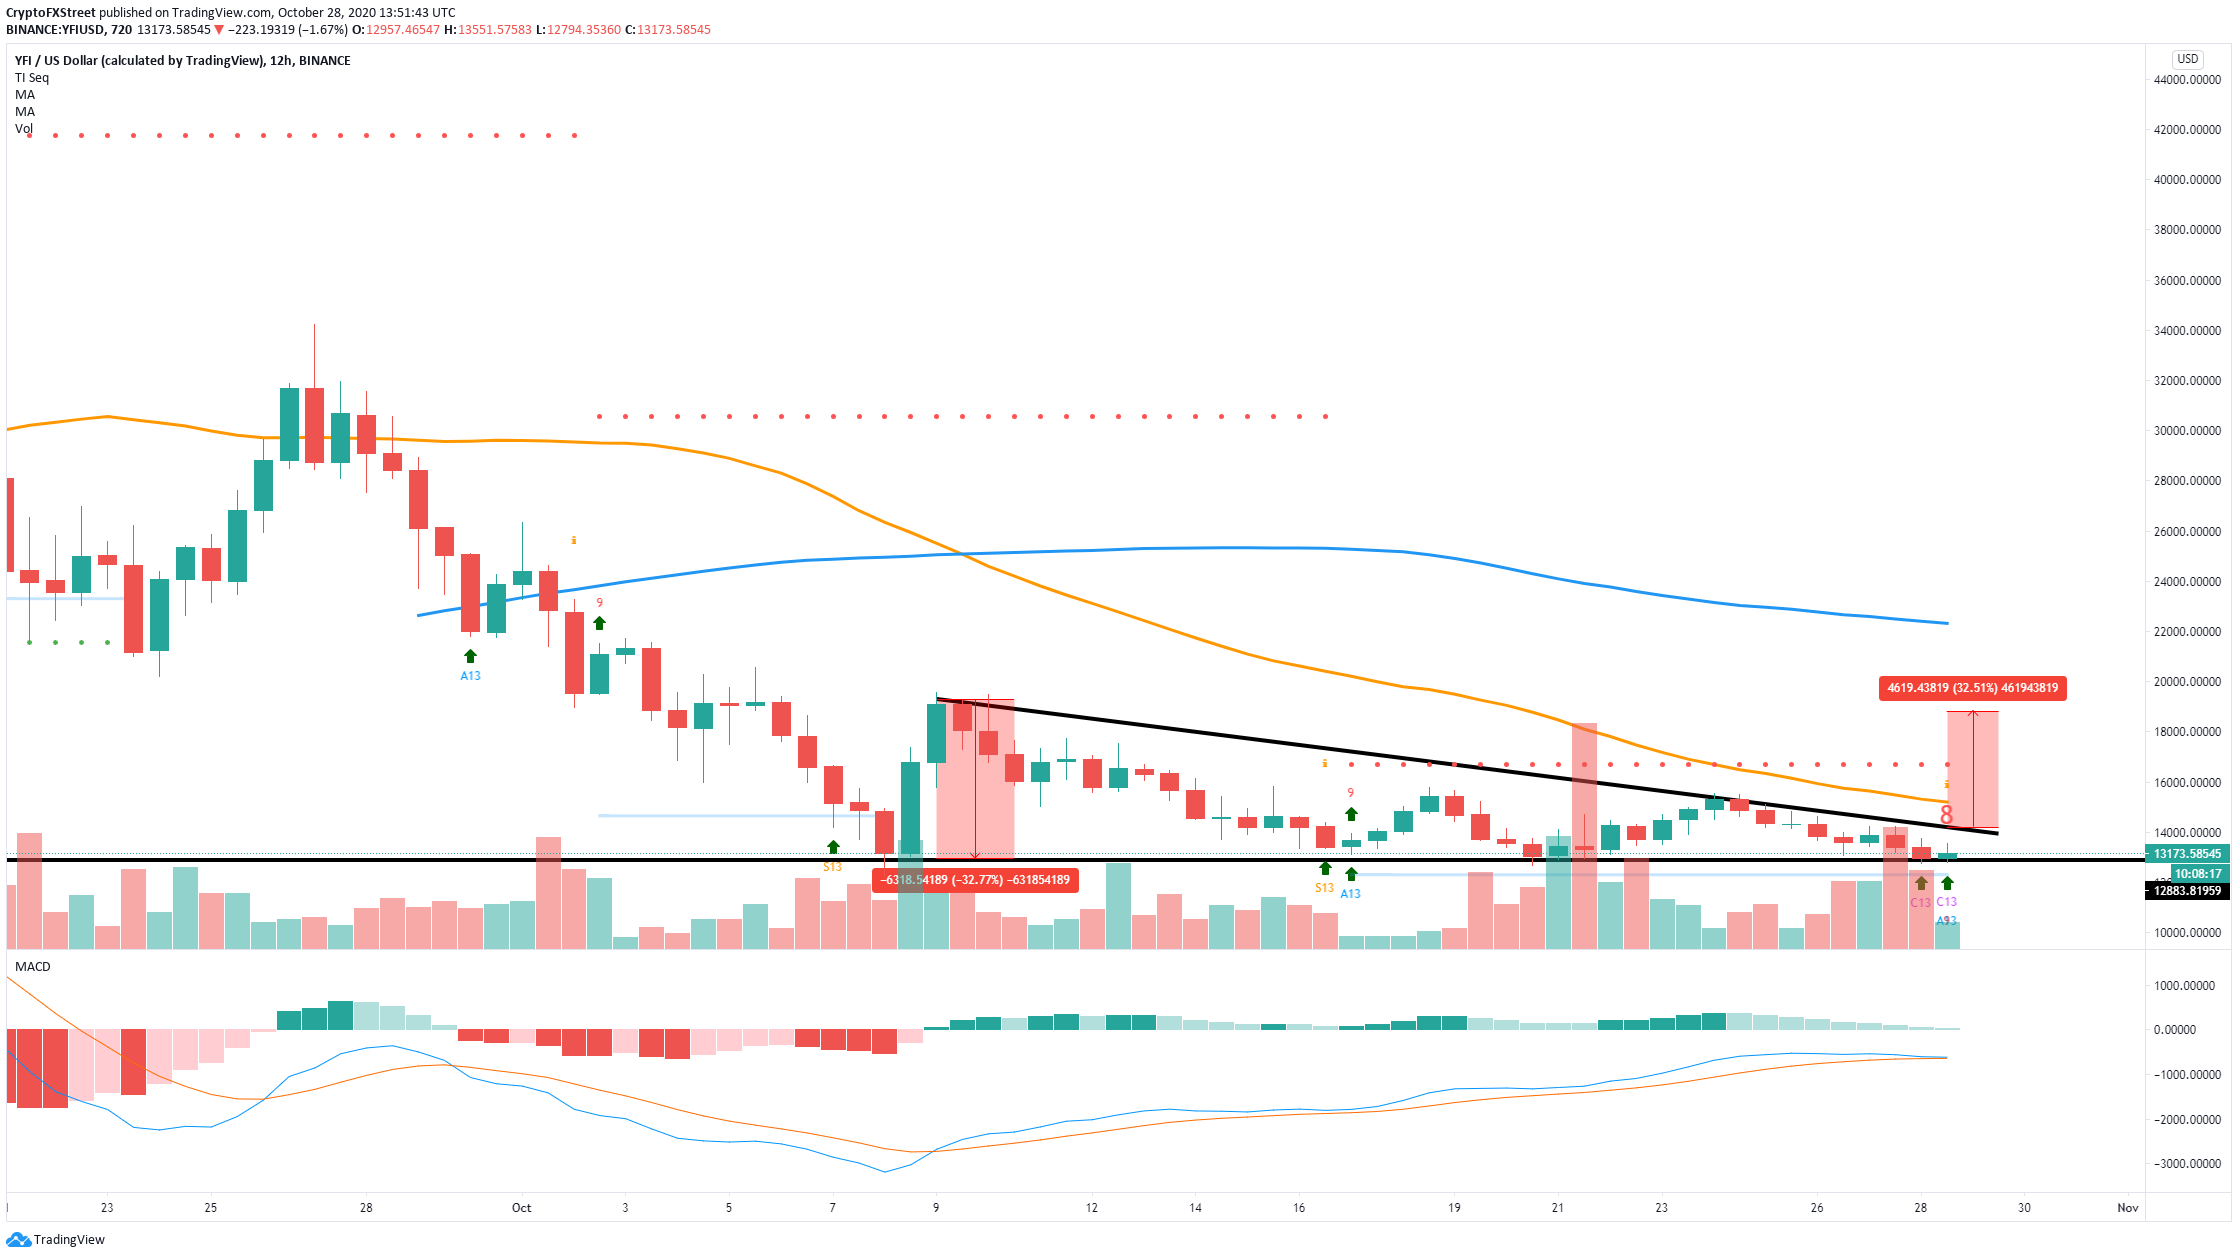
YFI/USDT 12-hour chart
A breakout above this point can push the digital asset towards the 50-SMA at $15,222 on the 12-hour chart. A longer-term price target could be almost $19,000, representing a 32% price jump from the triangle pattern.
