- OCEAN is consolidating in a descending triangle formation in the 4-hour chart.
- The IOMAP shows a lack of strong resistance levels upfront.
Ocean Protocol jumped up from $0.2547 on October 7 to $0.5245 on October 28. Since then, it has gone down to $0.4639 at the time of writing. Technical analysis suggests that a jump to $0.5420 is on the cards for OCEAN.
Primed for a breakout?
The four-hour price chart is presently consolidating in a descending triangle formation. The price target for the pattern is equal to the entry price minus the vertical height between the two trend lines at the time of the breakdown. In this case, that target is coming out to be $0.5420.
-637402144450569386.png)
OCEAN/USDT 4-hour chart
This bullish outlook is further validated by IntoTheBlock’s In/Out of the Money Around Price (IOMAP). As one can see, there is a lack of substantial resistance barriers upfront for OCEAN. The most notable resistance zone is at $0.51, wherein 26 addresses had previously purchased 17 million tokens.
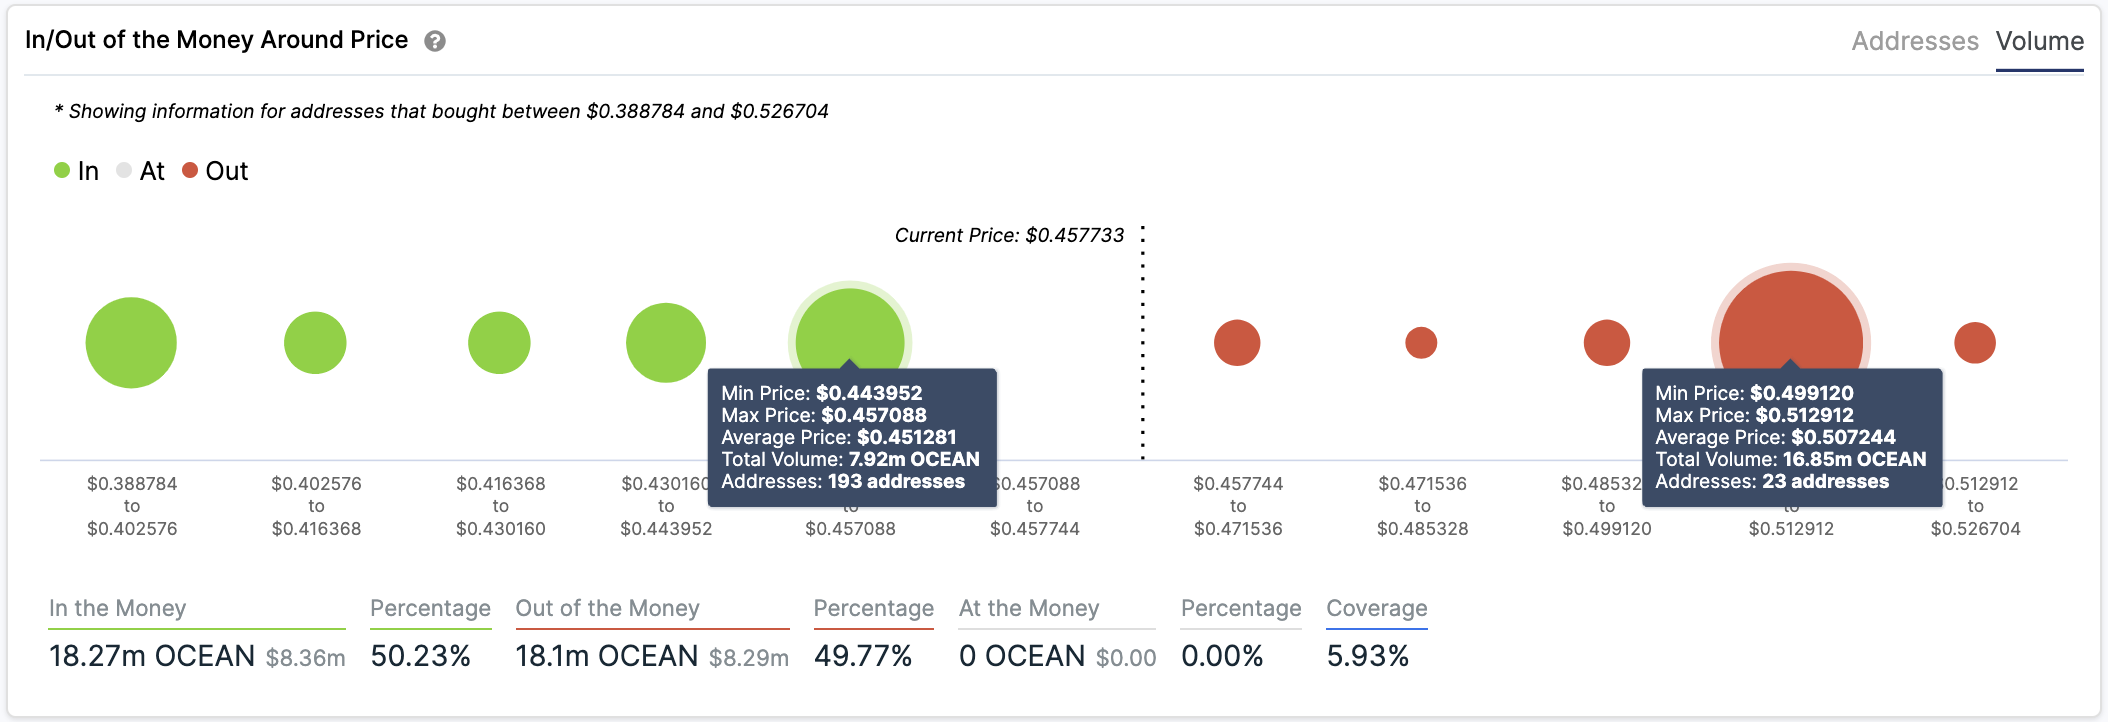
OCEAN IOMAP
Santiment’s holders distribution chart adds further credence to this bullish outlook. It looks like the number of addresses holding 1 million to 10 million went up from 141 on November 4 to 146 at the time of writing. Similarly, the number of addresses holding >10 million tokens rose from 17 on November 3 to 18.
%20%5B03.35.31,%2006%20Nov,%202020%5D-637402143068403096.png)
OCEAN holders distribution
This bullish hypothesis will hold only if the $0.45 support wall stays strong. As the IOMAP shows, a break below this wall will see OCEAN fall to $0.39 before it meets another moderate-to-strong support wall. A further break below will see OCEAN go down to the downside target of $0.31, as determined by the triangle.
