- Chainlink price is currently inside an ascending parallel channel formed on the daily chart.
- Several indicators suggest that Chainlink is on the verge of a breakout.
Chainlink price has established a robust daily uptrend forming several higher lows and higher highs in a row. The digital asset is bounded inside an ascending parallel channel, which awaits a clear breakout favoring the bulls.
Chainlink looks poised for a breakout to $18
The ascending parallel channel formed on the daily chart has contained Chainlink price since September 24. The current price is $12.97 closer to the upper boundary of the pattern and defending the 100-SMA at $12.1 as a support level.
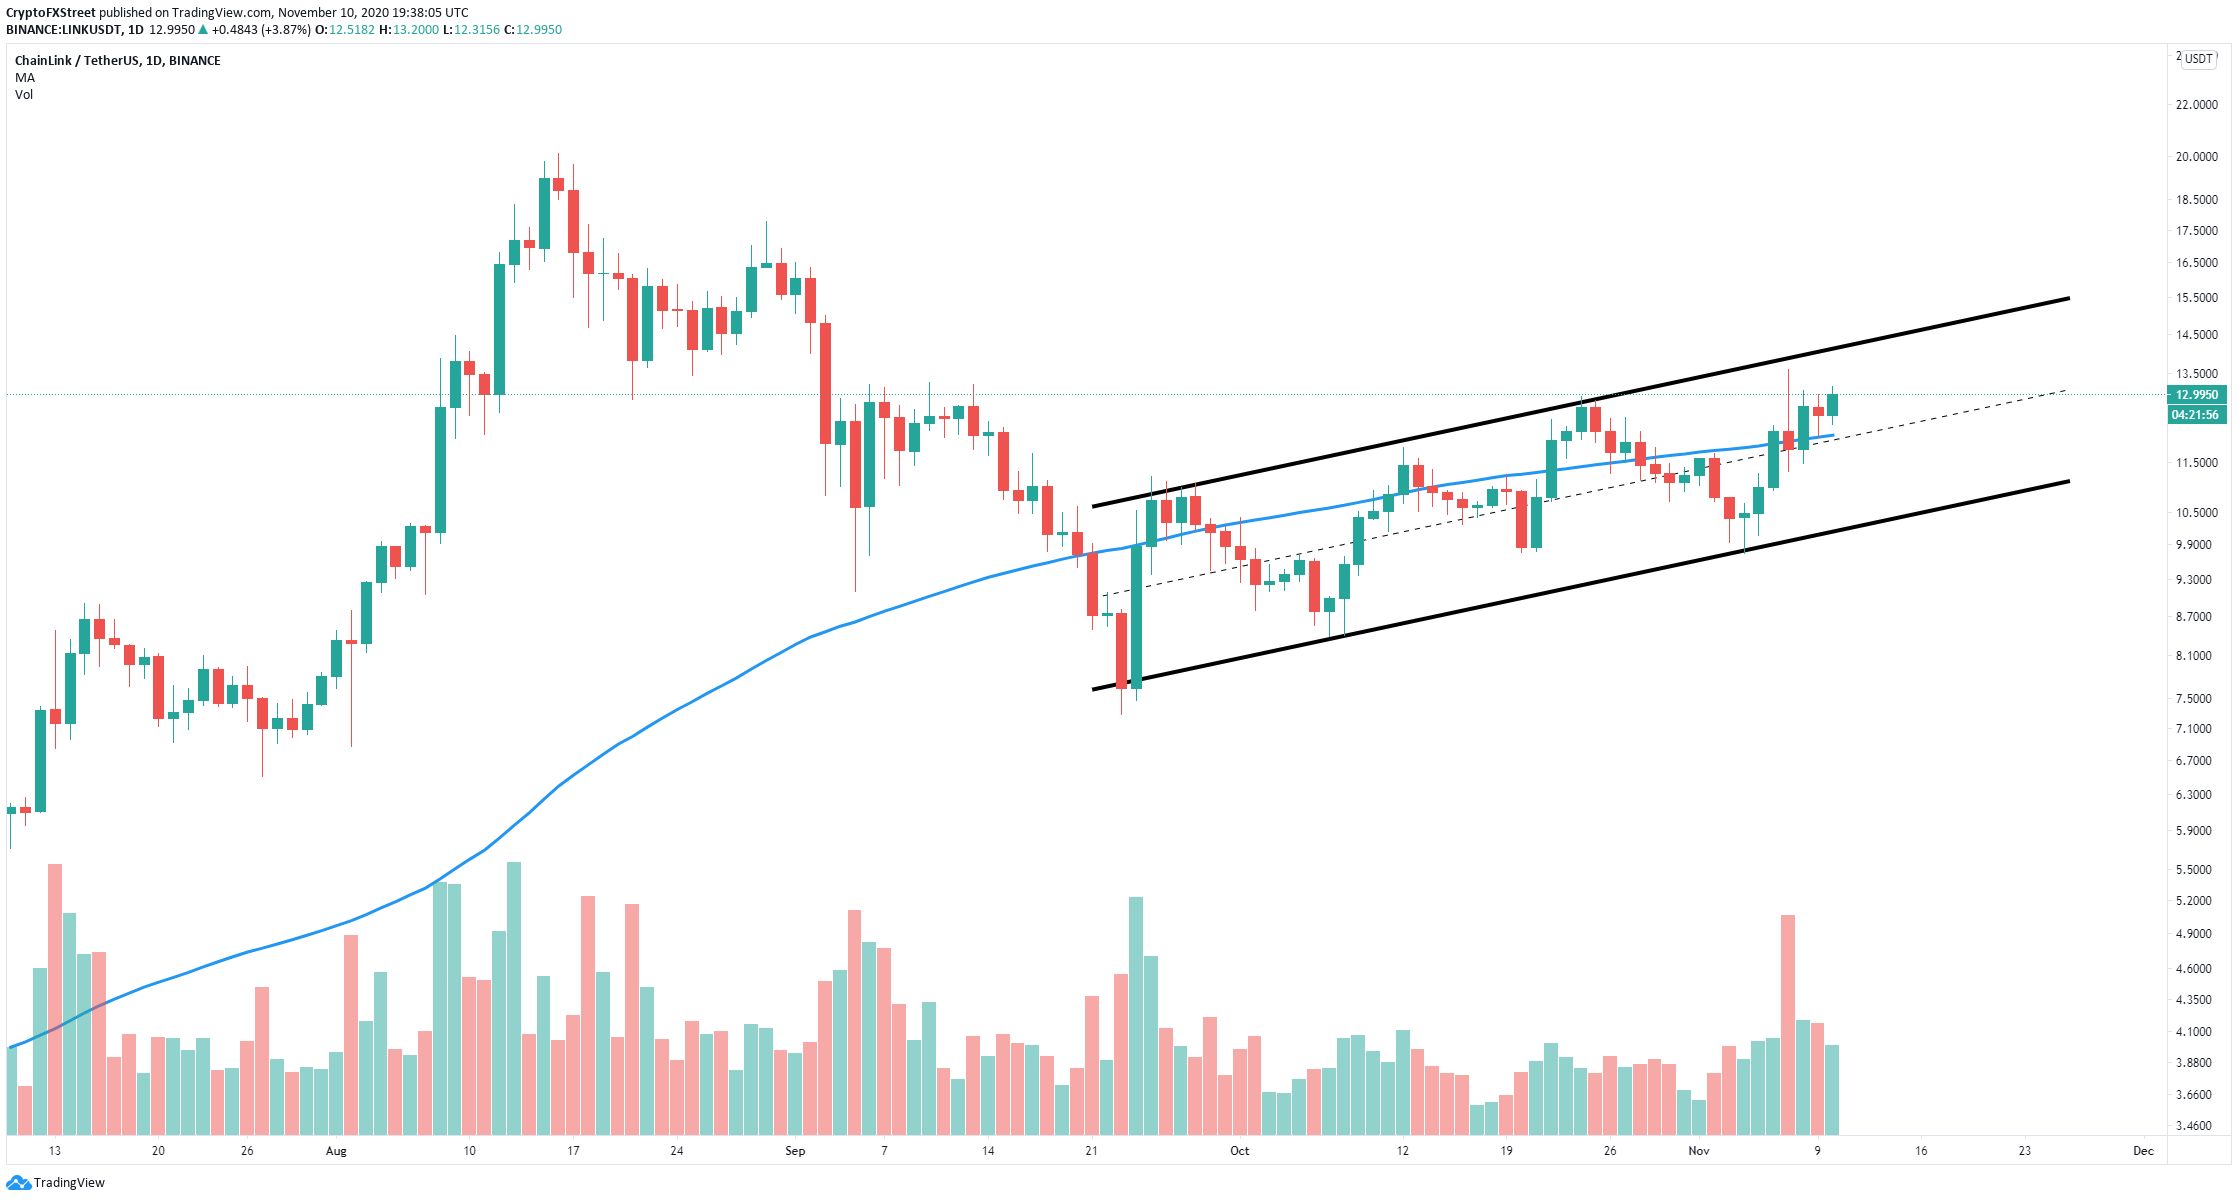
LINK/USD daily chart
The Bollinger Bands have squeezed significantly over the past month as Chainlink price action has been relatively stable. The compressed bands indicate that the digital asset is close to a breakout.
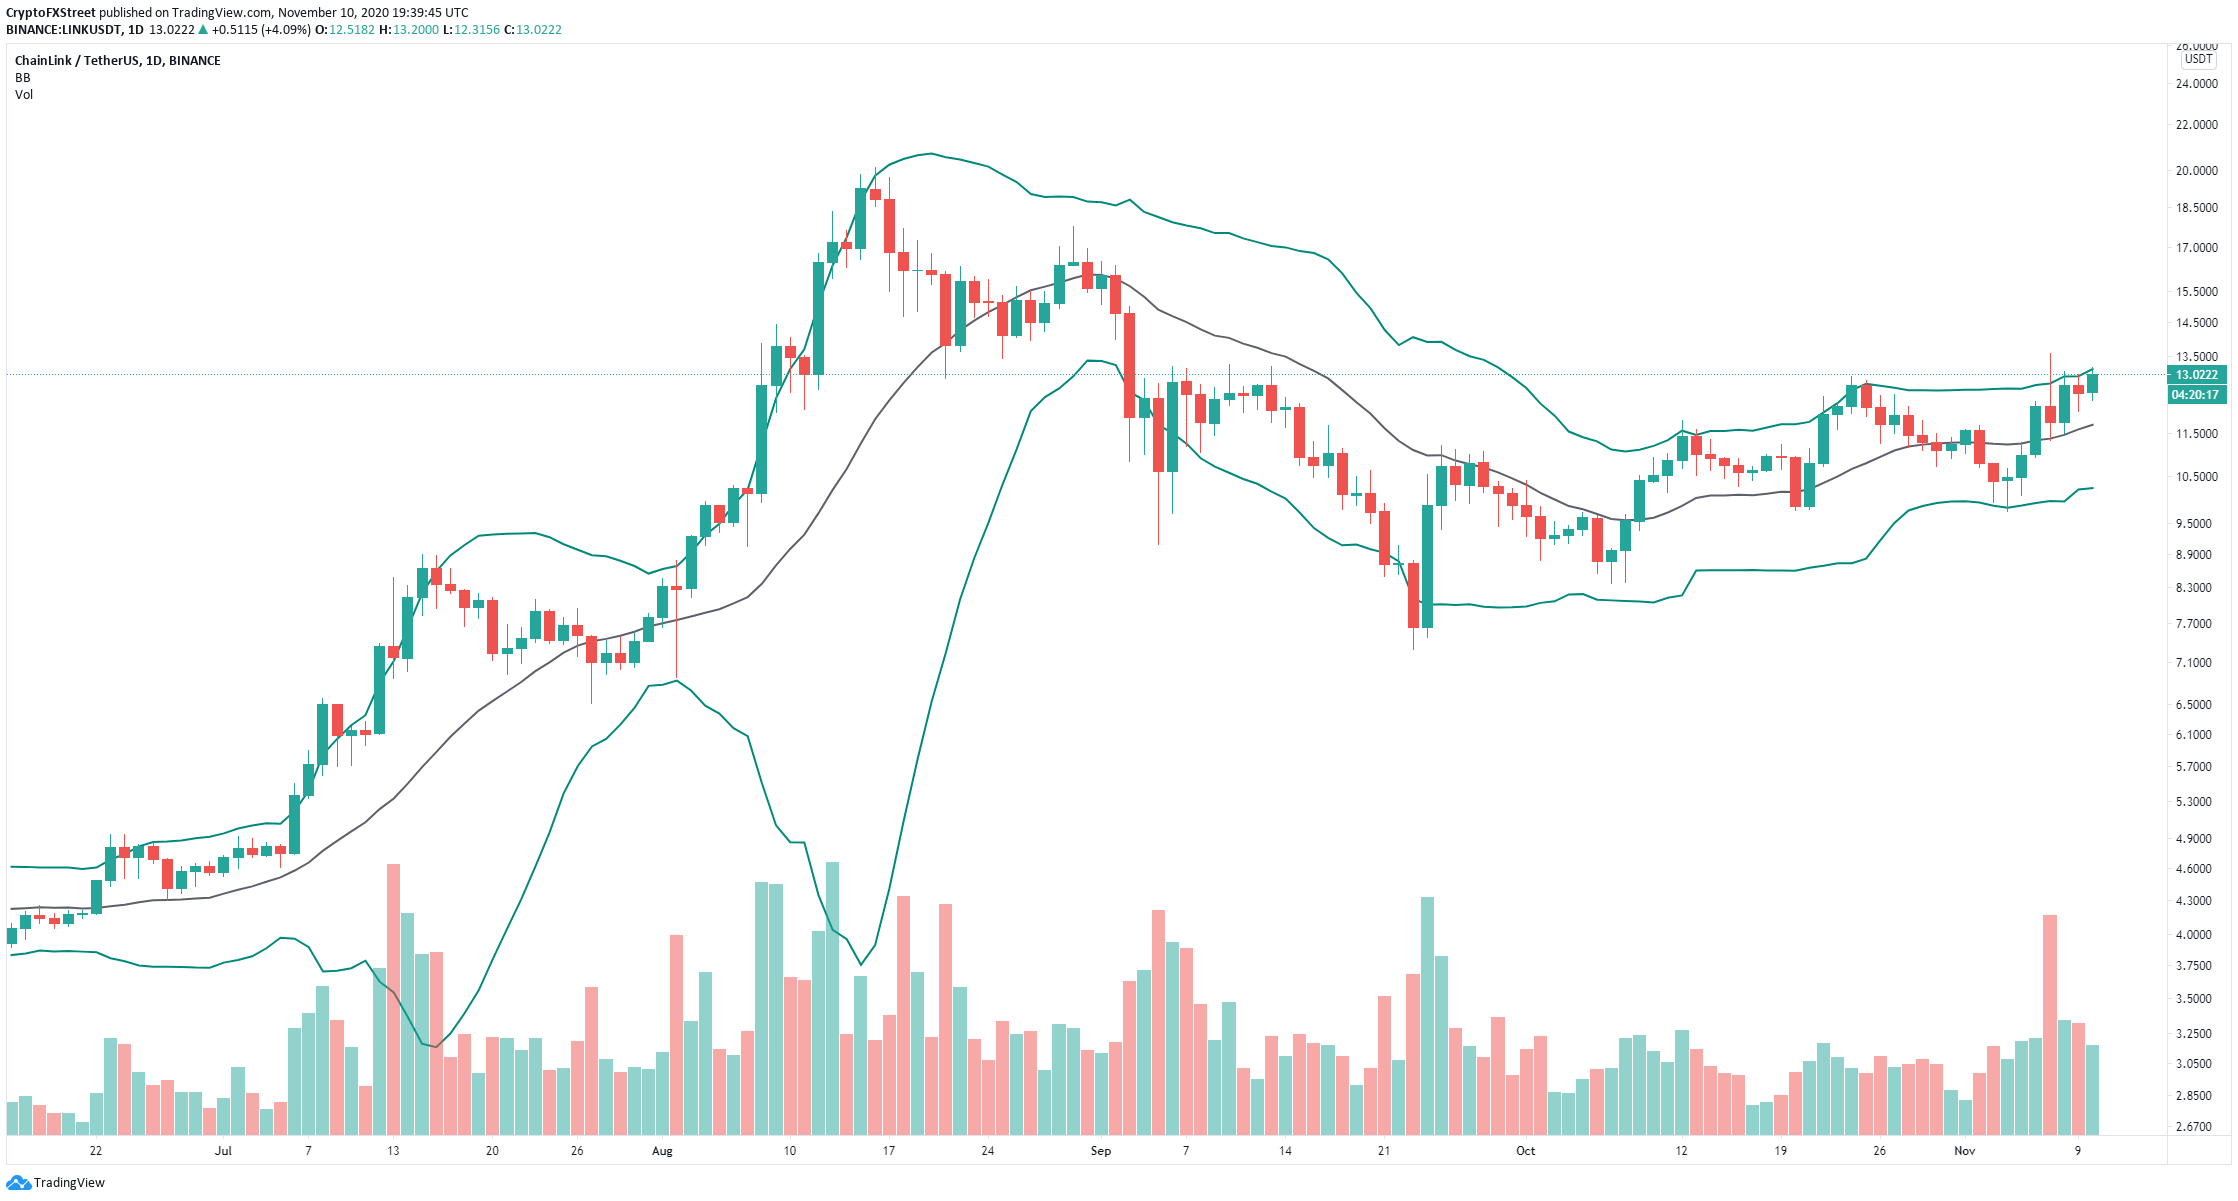
LINK/USD daily chart
The current price at $12.97 is right below the upper Band at $13.2. A breakout above this point would most likely push Chainlink above the upper trendline of the ascending channel targeting $18.
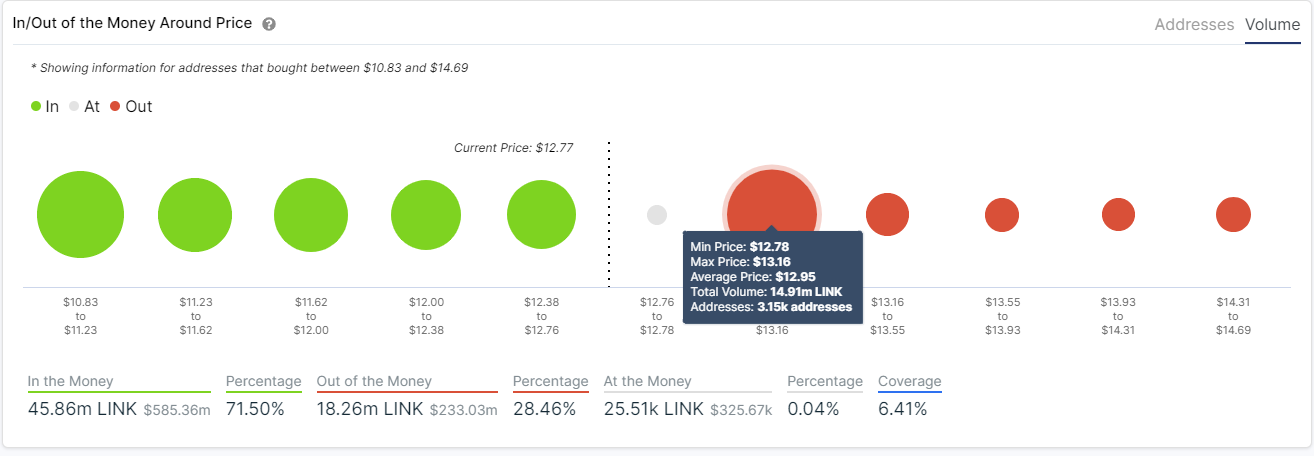
LINK IOMAP chart
The In/Out of the Money Around Price chart supports this theory as it shows the most significant resistance area to be located between $12.78 and $13.16, where 3,150 addresses purchased close to 15 million LINK. There seems to be very little opposition above this point.
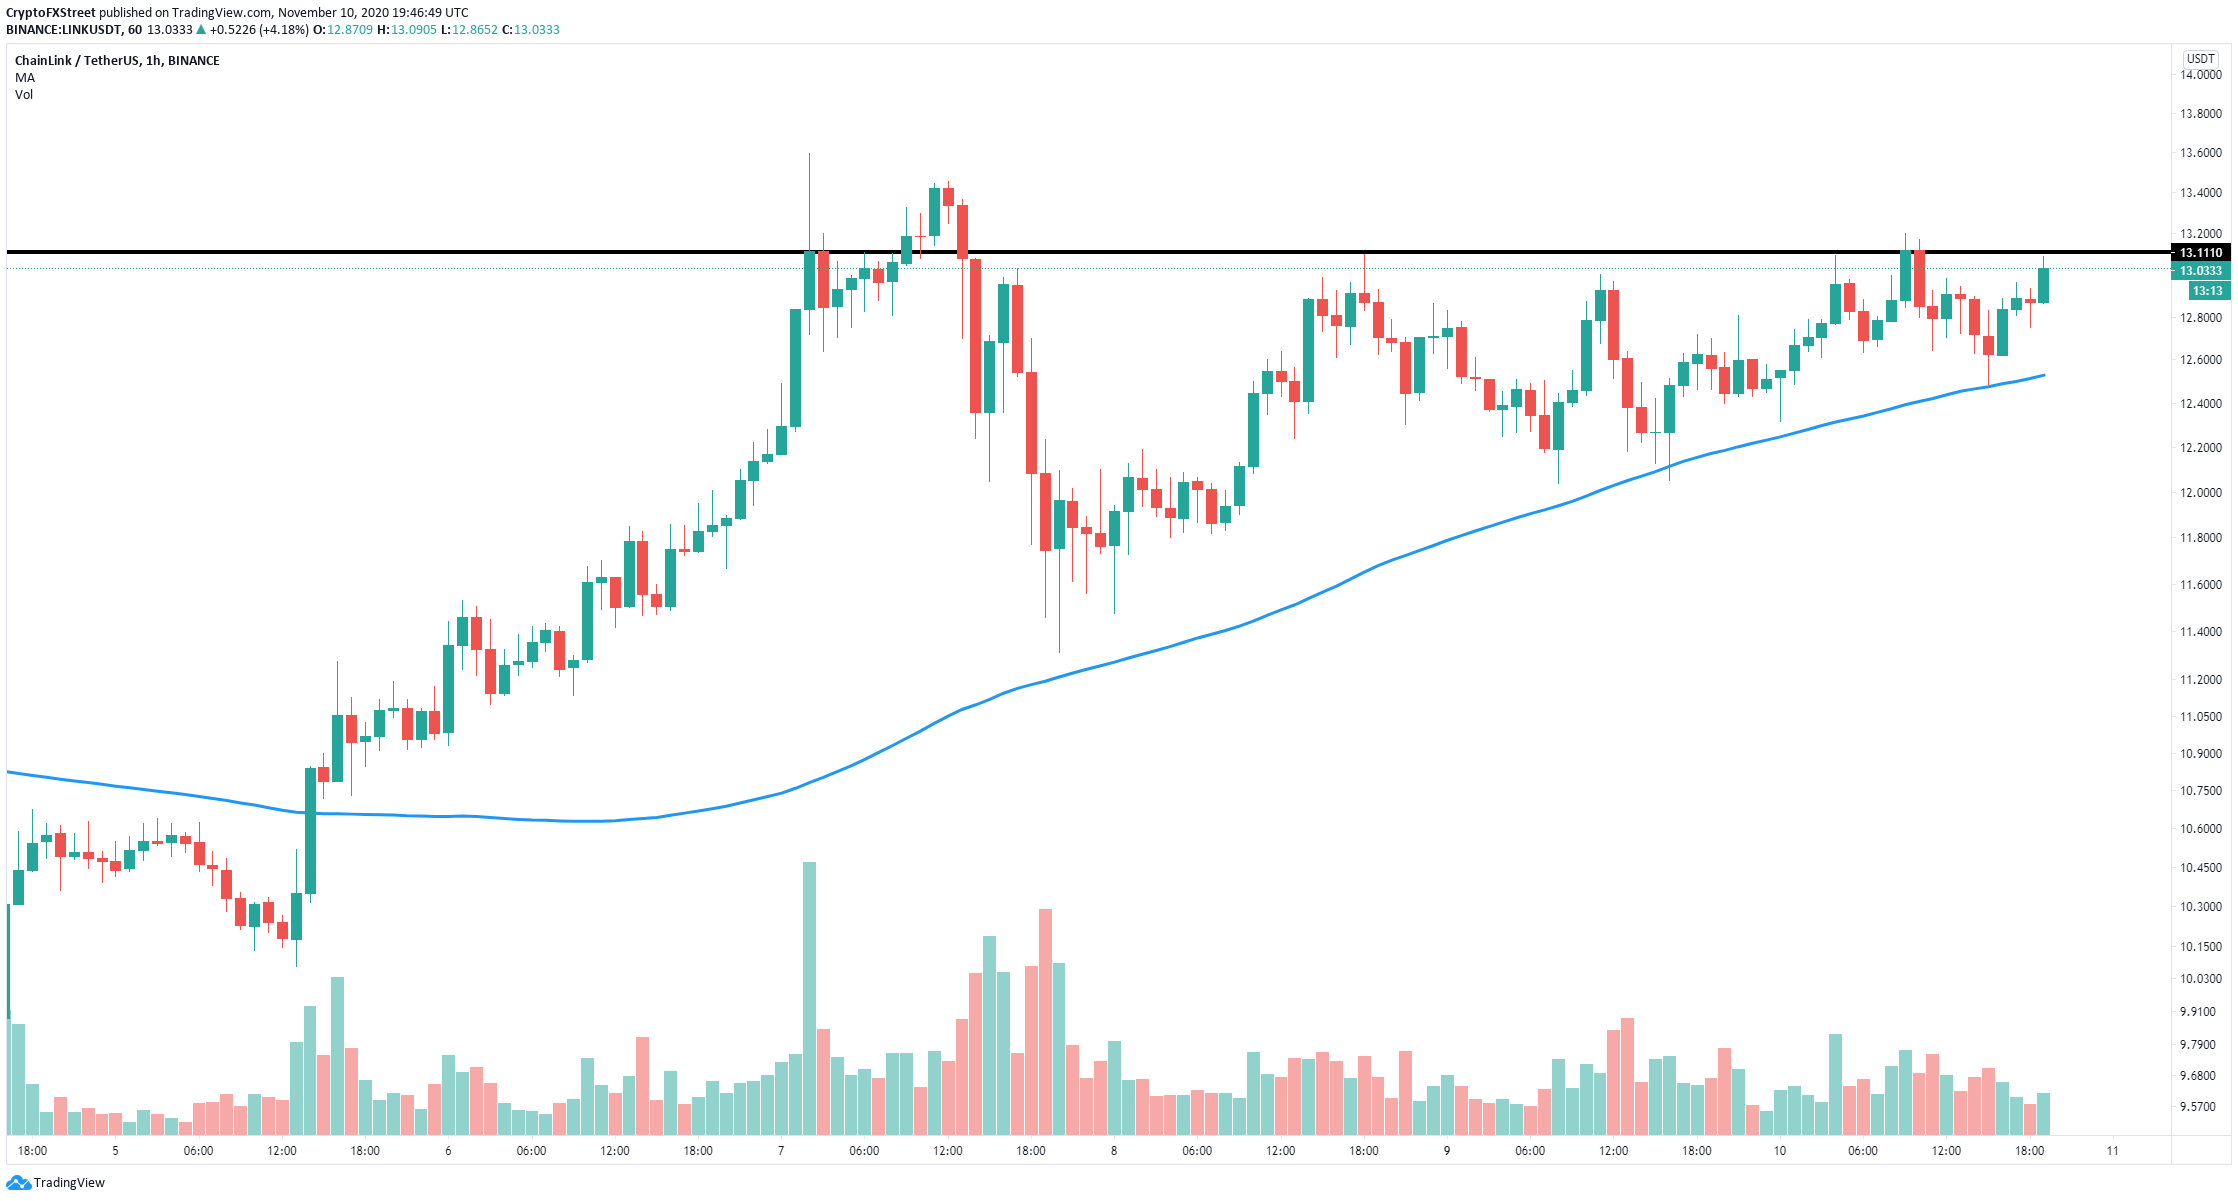
LINK/USD 1-hour chart
Despite the several bullish indicators, on the hourly chart, Chainlink price faces a significant resistance level established at $13.11 and tested on several occasions, on November 8 and 10. Rejection from this point can drive the price towards the 100-SMA at $12.5, which has been holding the price since November 5.
