- The Crypto Fear and Greed Index has been showing extreme greed for the past week.
- It seems that many altcoins are taking a beating despite Bitcoin’s growth.
As Bitcoin continues climbing above $16,000, investors are becoming even more greedy. Altcoins have been taking a significant beating in the past month. It seems that bears are regaining control over the price of many DeFi tokens.
Uniswap price goes down by 8% in the past 48 hours
After a massive price spike on November 5, Uniswap price hit a high of $3.21 on November 11, which was right above a long-term resistance level at $3.14. However, bulls couldn’t hold this level and UNI dropped to a low of $2.833 shortly after.
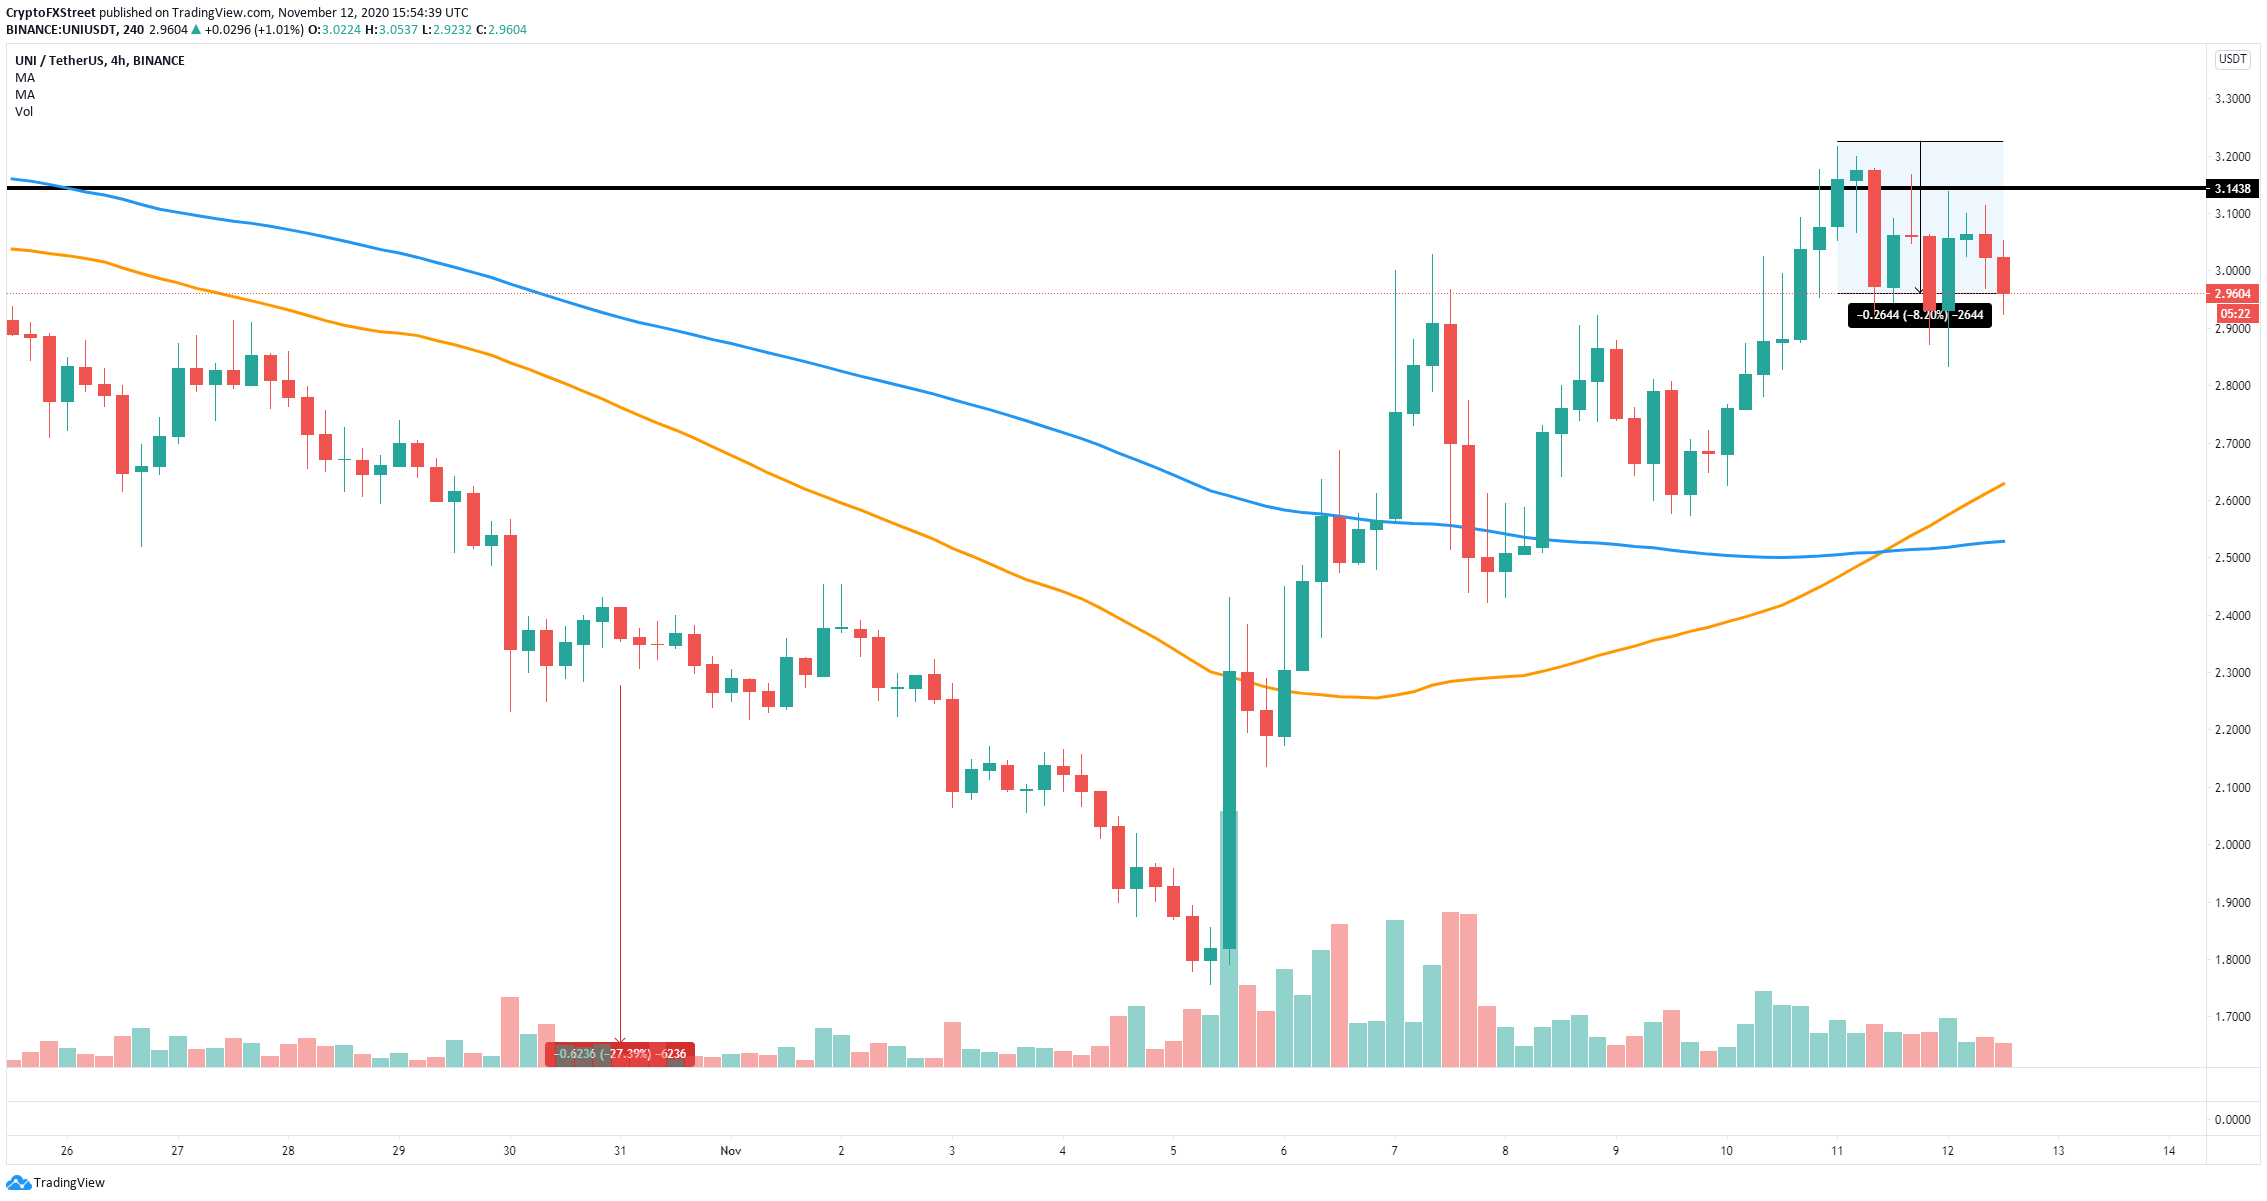
UNI/USD 4-hour chart
On the hourly chart, Uniswap price has lost the uptrend and confirmed a downtrend after establishing several lower lows and lower highs. The 50-SMA at $3.04 was also lost. A breakdown below the 100-SMA at $2.9 can drive UNI price towards the low of $2.83.
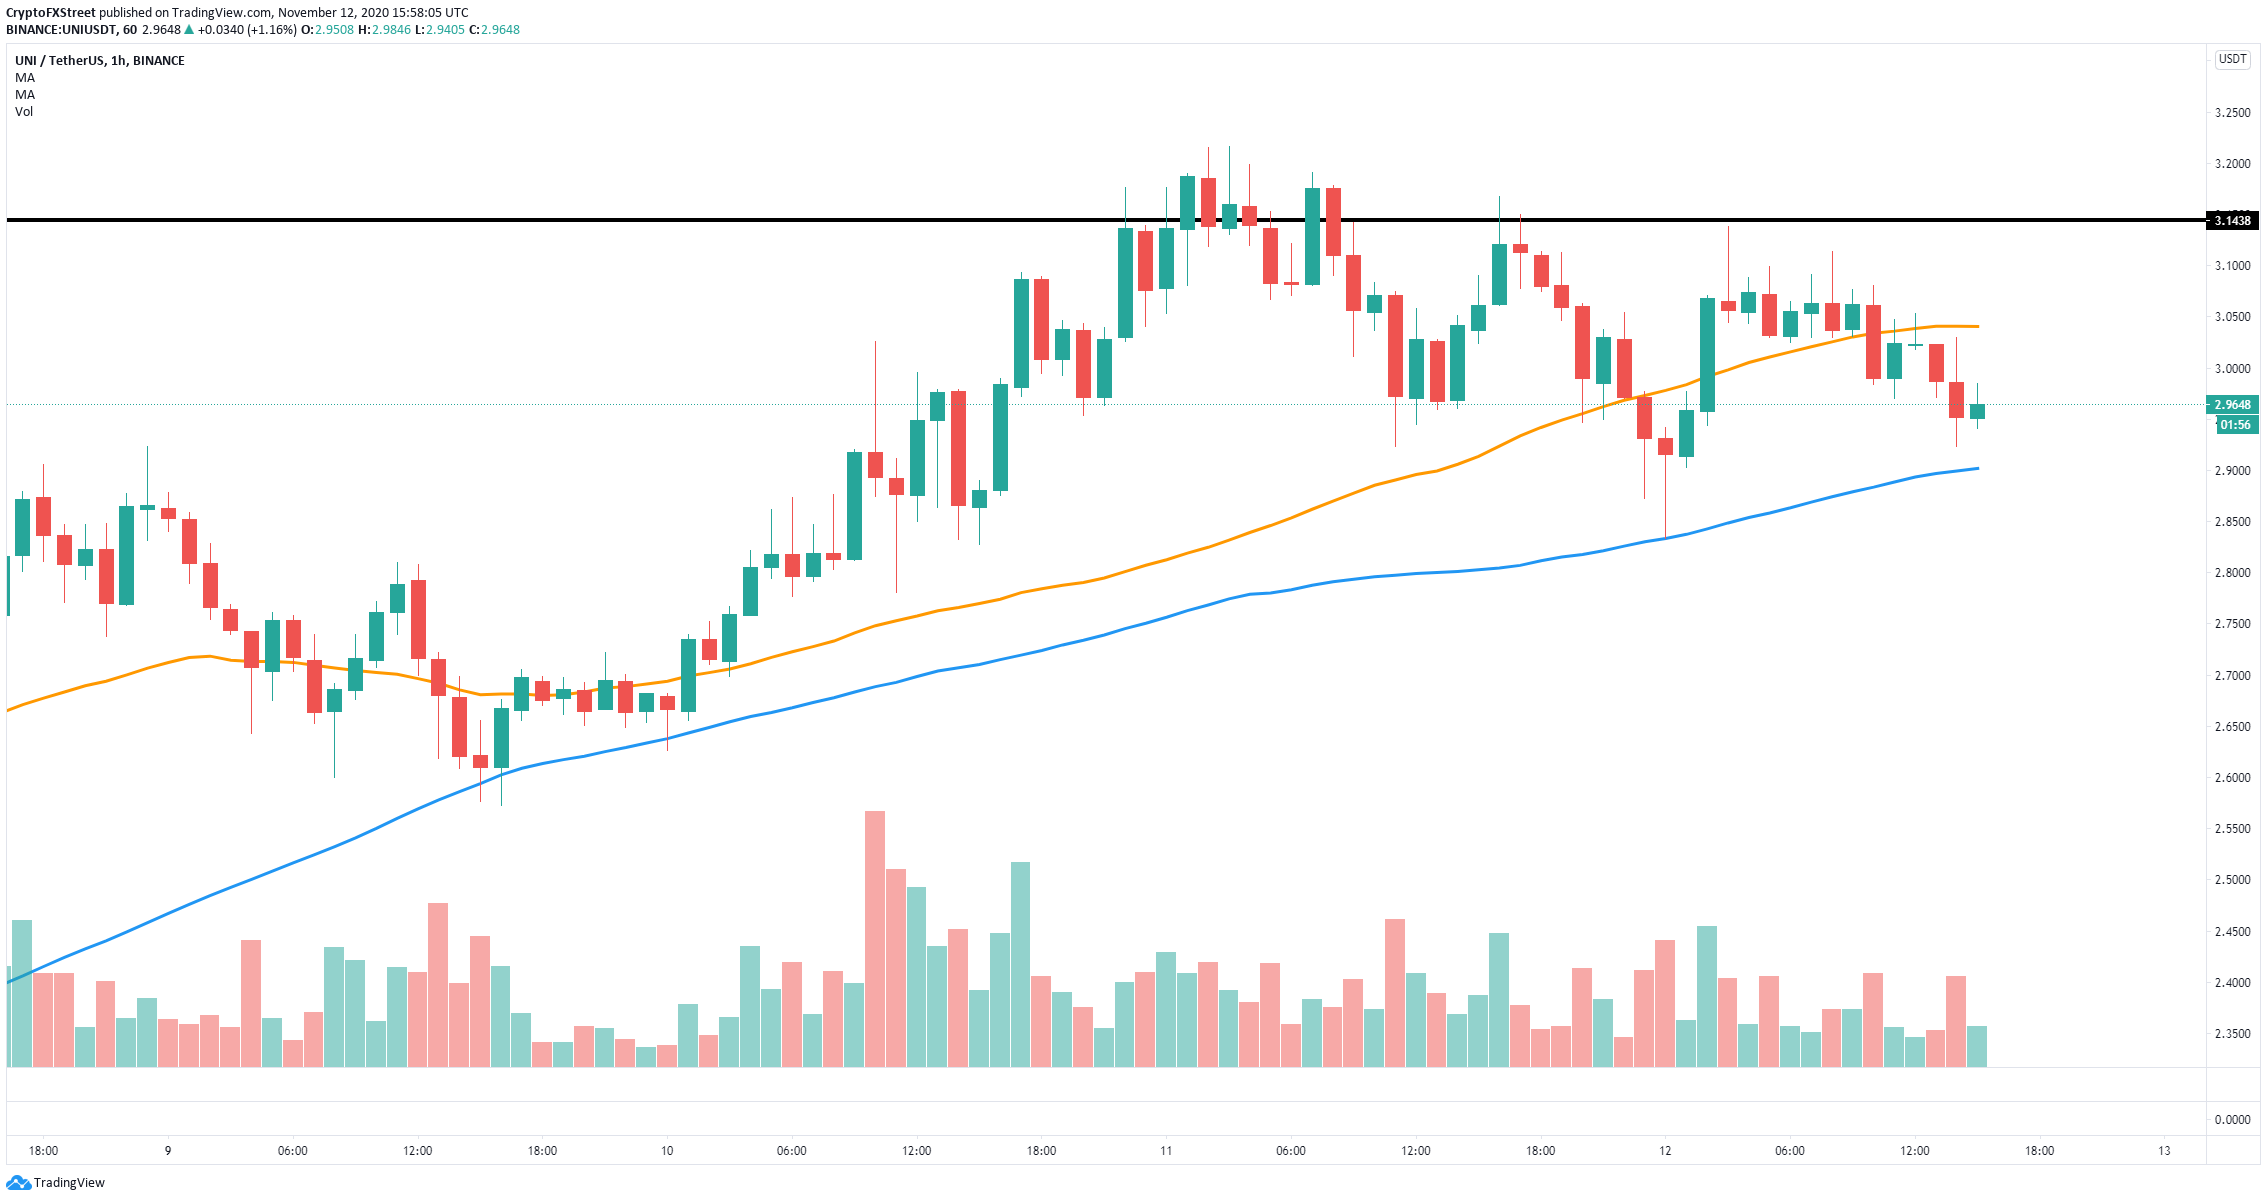
UNI/USD 1-hour chart
On the other hand, although the In/Out of the Money Around Price (IOMP) chart shows significant resistance ahead from $2.98 until $3.15, it also indicates that support below, is in fact, stronger.
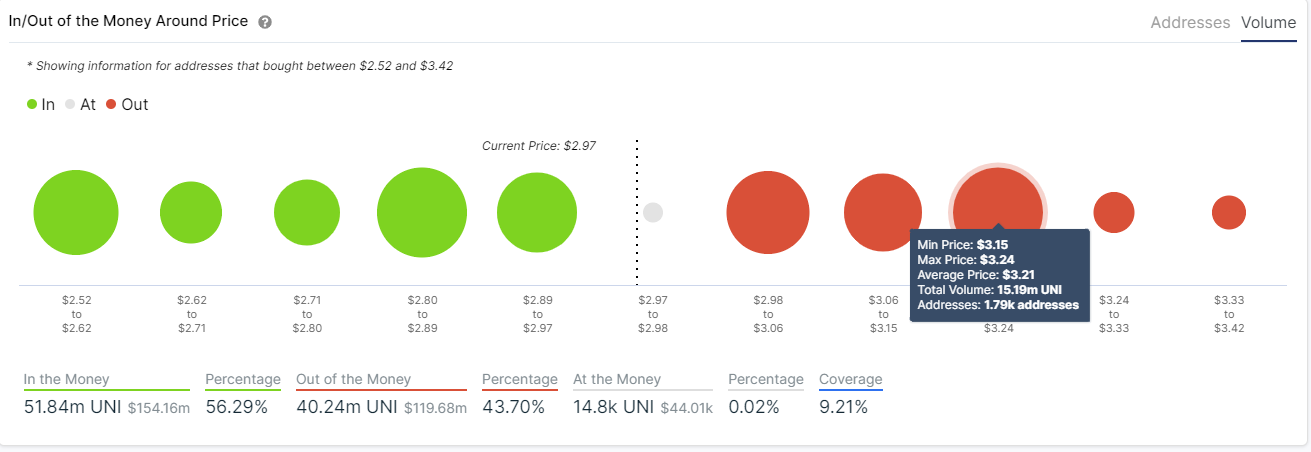
UNI IOMAP chart
The IOMAP chart confirms that the $3.14 resistance trendline is critical. A breakout above this point can easily drive Uniswap price to $3.42, the next area with significant selling interest, and as high as $3.64, the high formed on October 10.
YFI price seems poised for a further pullback
Year Finance price is down by 17% in the past 48 hours after hitting $19,350 on November 11. On the hourly chart, YFI bulls have lost the uptrend and the 50-SMA at $17,325, followed by the 100-SMA at $16,460.
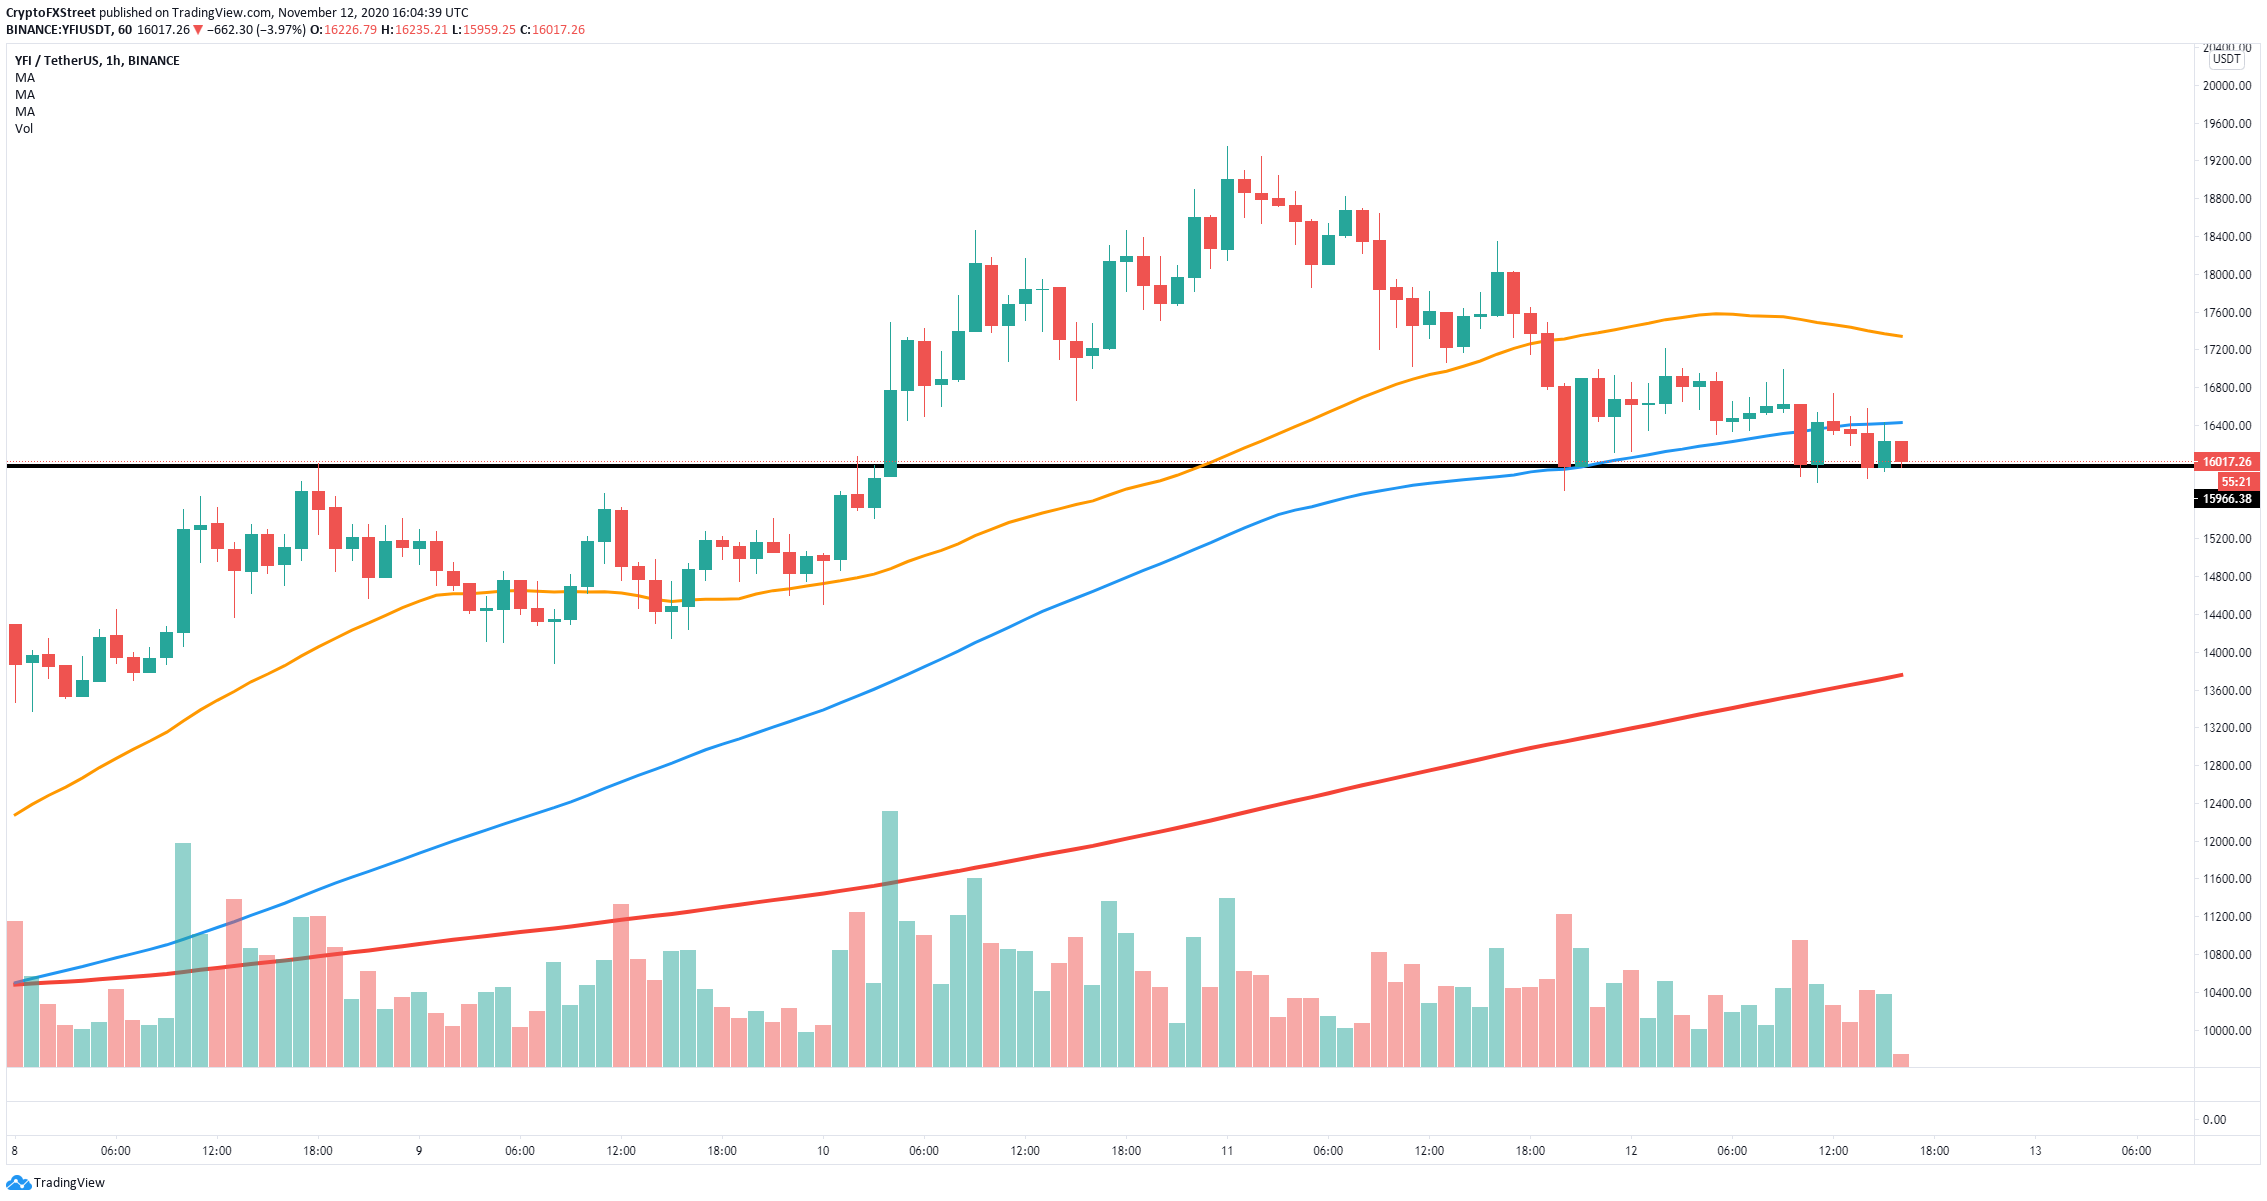
YFI/USD 1-hour chart
The current YFI price at $16,218 is hanging by a thread. The most critical support level seems to be formed at $16,000. A breakdown from this point could drive the price towards the 200-SMA at $13,782.
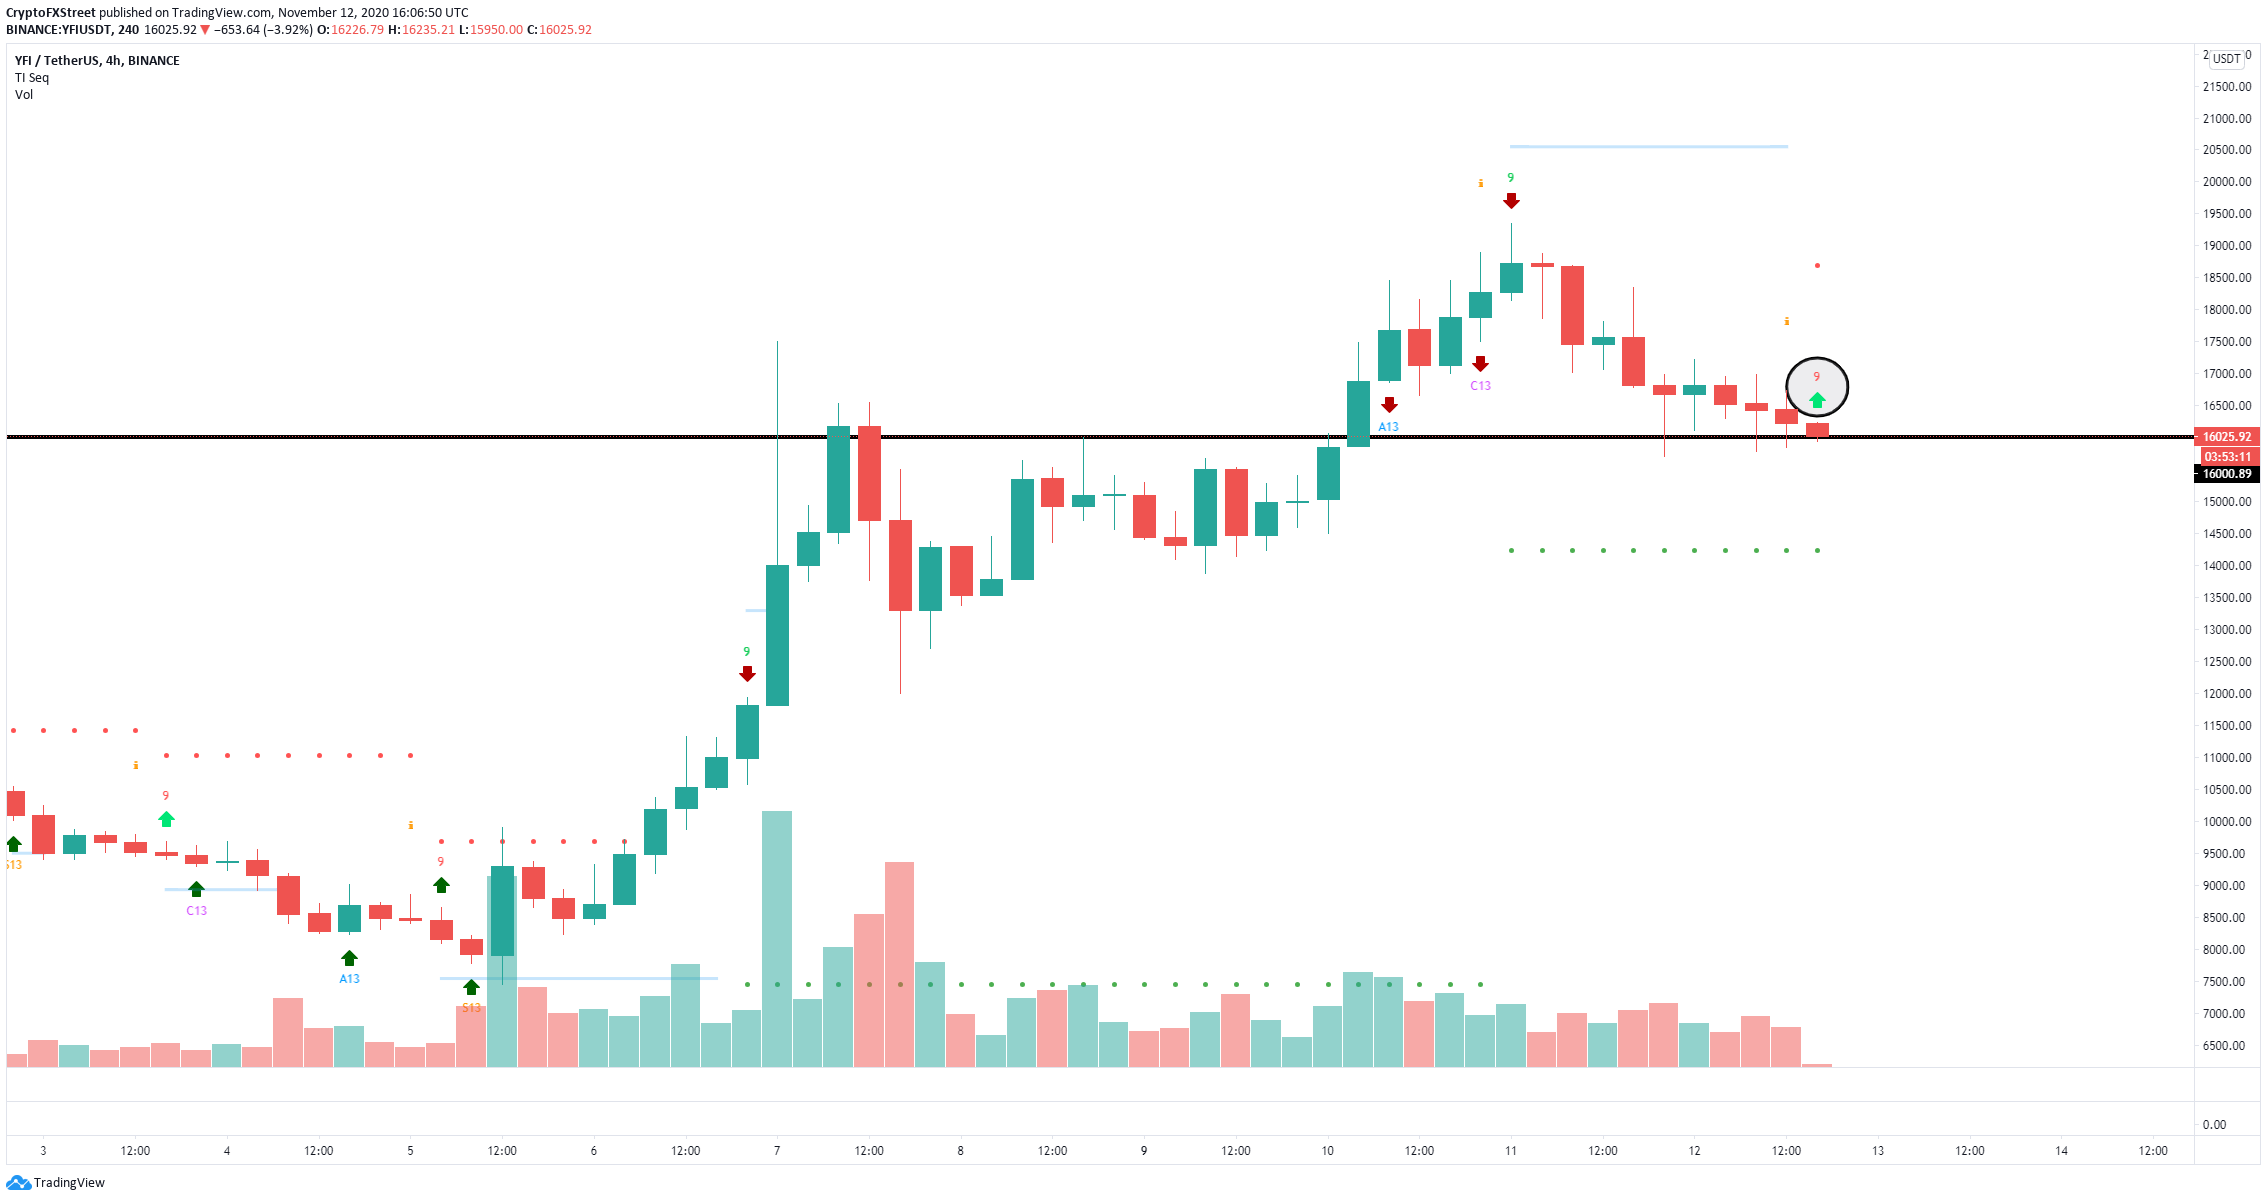
YFI/USD 4-hour chart
However, the TD sequential indicator has just presented a buy signal on the 4-hour chart in the form of a red nine candle. Confirmation of this signal could drive YFI price towards the high at $19,354 if the critical support level at $16,000 holds.
Aave price takes a huge 26% beating and shows no signs of recovery
Unlike the two DeFi tokens above, Aave seems to have the worst pullback and shows no signs of recovery in the short-term. On the hourly chart, Aave price is down by 26% in the past 48 hours, confirming a strong downtrend.
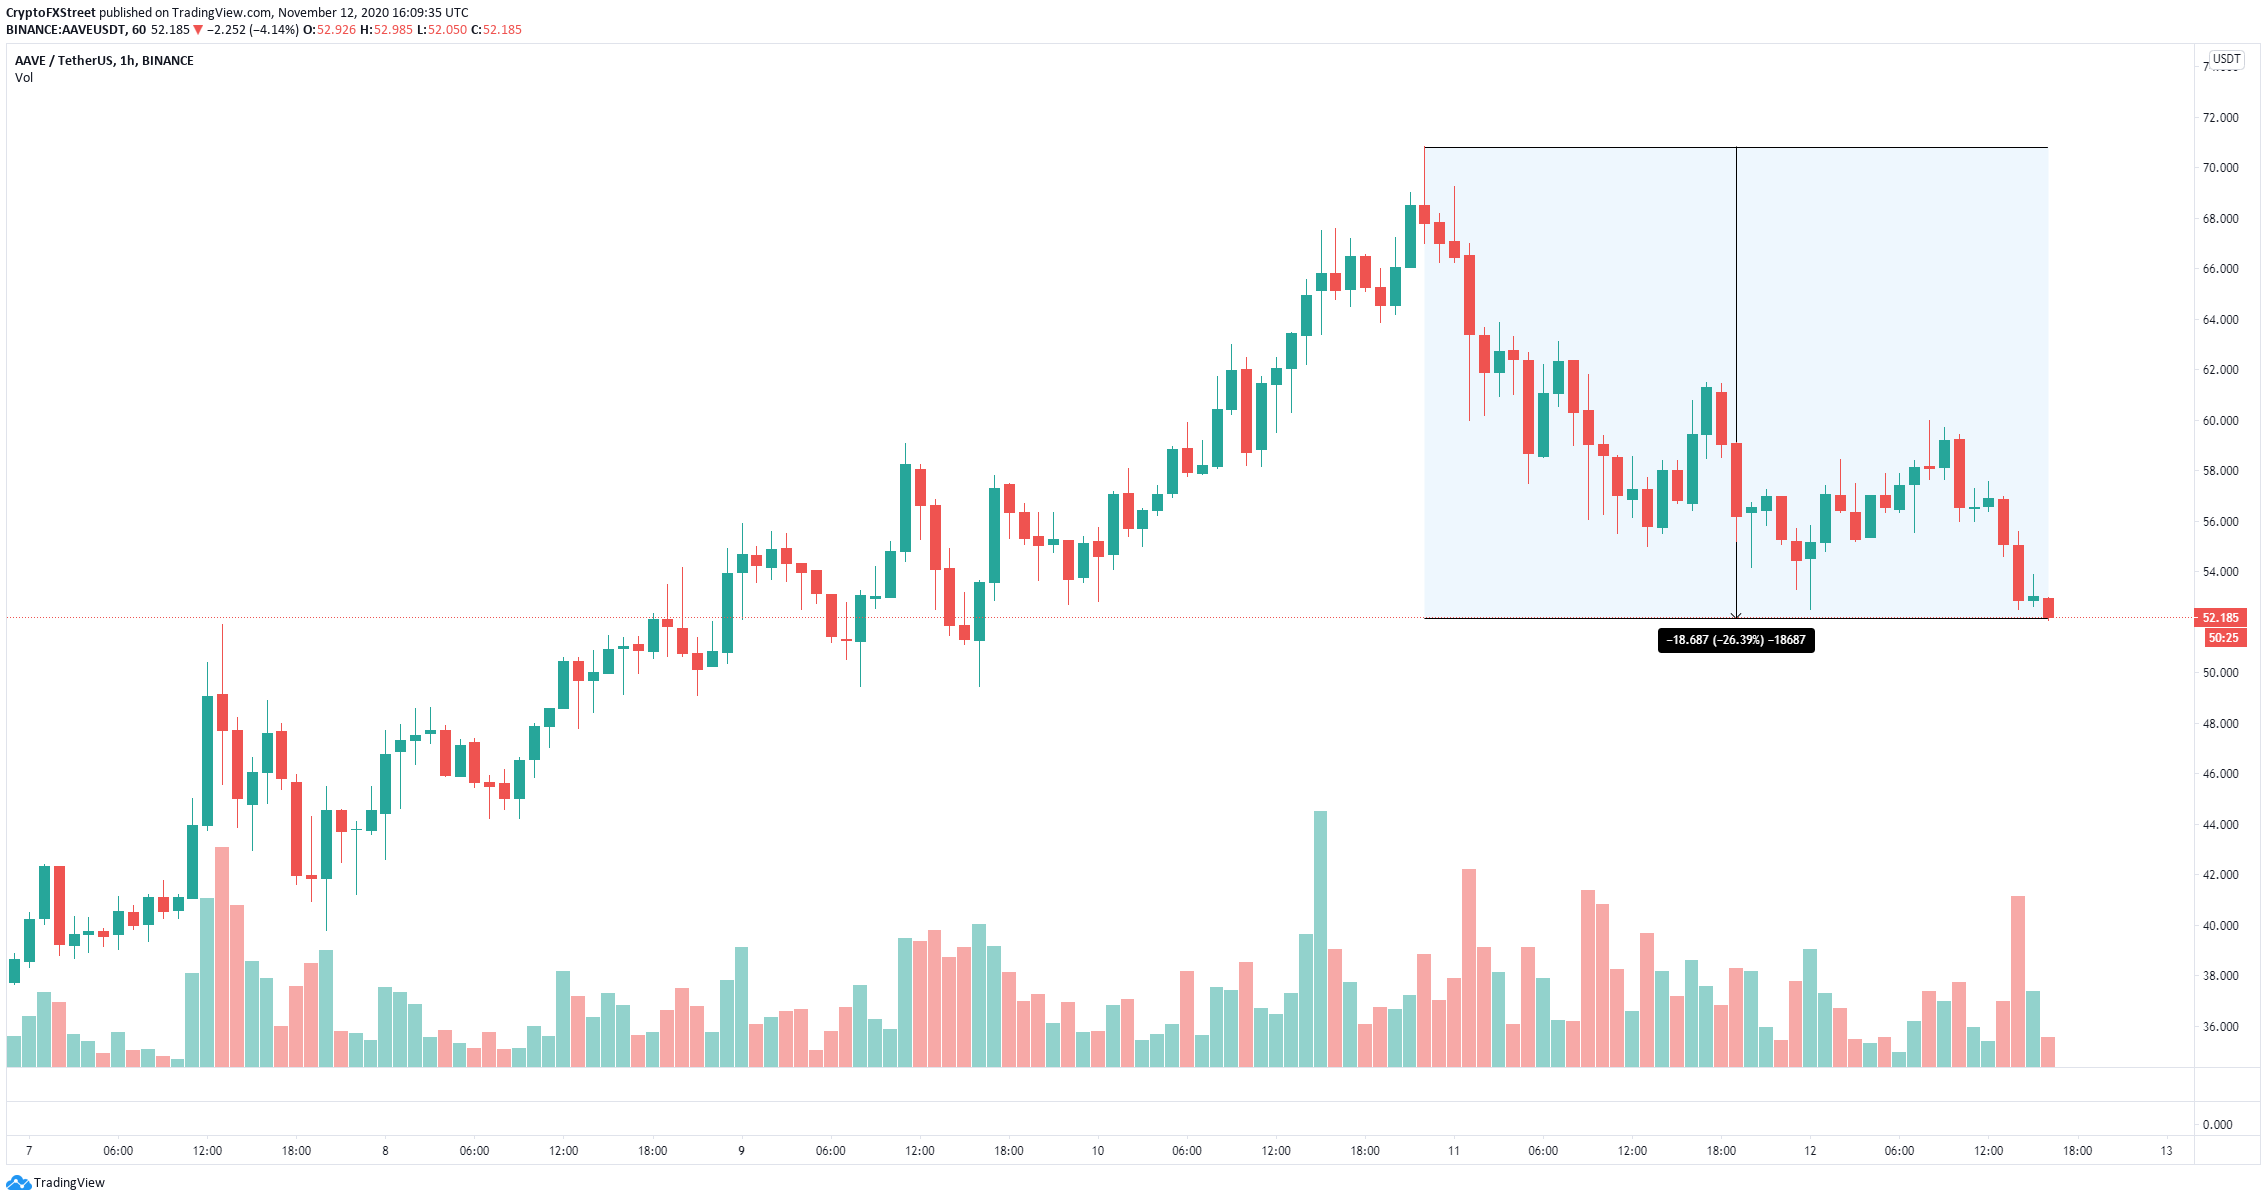
AAVE/USD 1-hour chart
The IOMAP chart shows a robust resistance area between $55.32 and $56.89 and barely any support levels below in comparison. It seems that Aave price could be targeting $44.31 as the next stop in the short-term.
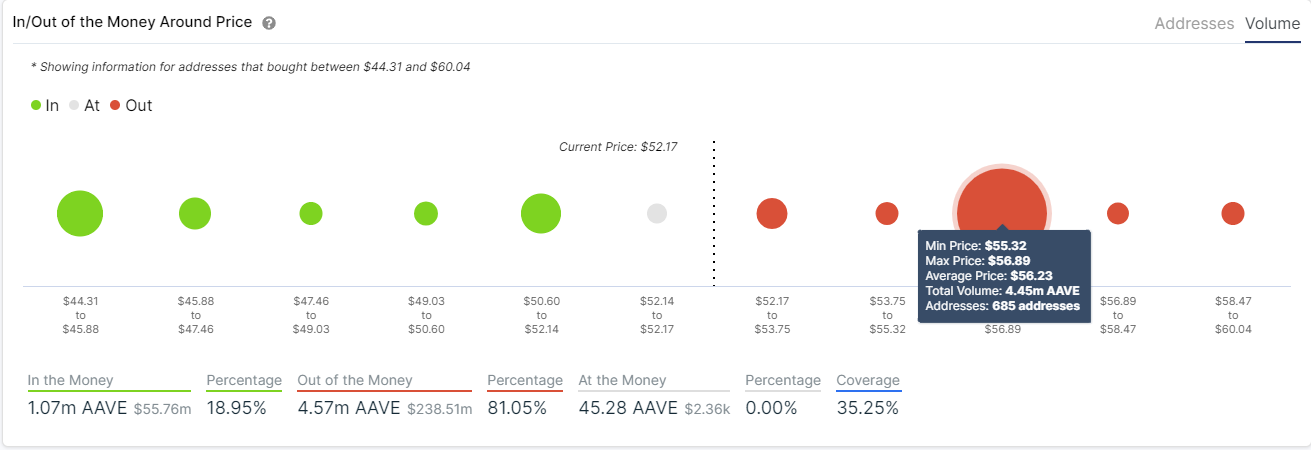
AAVE IOMAP chart
On the other hand, the same chart shows very little opposition above the critical resistance level at $56.89. A breakout from this point would lead Aave towards $60, and potentially the last high at $70.
