- Band Protocol price is currently just above a critical support level at $5.55.
- Several indicators suggest that the digital asset could be on the verge of a significant upwards move.
Band Protocol price formed a robust support level at $5.55, which was tested several times since November 8. Successfully defending it again could drive Band Protocol price to higher highs on the 4-hour chart.
BAND awaits potential buy signal
On the 4-hour chart, the TD Sequential indicator has presented a red ‘8’, which is usually followed by a buy signal. Band Protocol price is currently $5.61, just above the critical support level at $5.55.
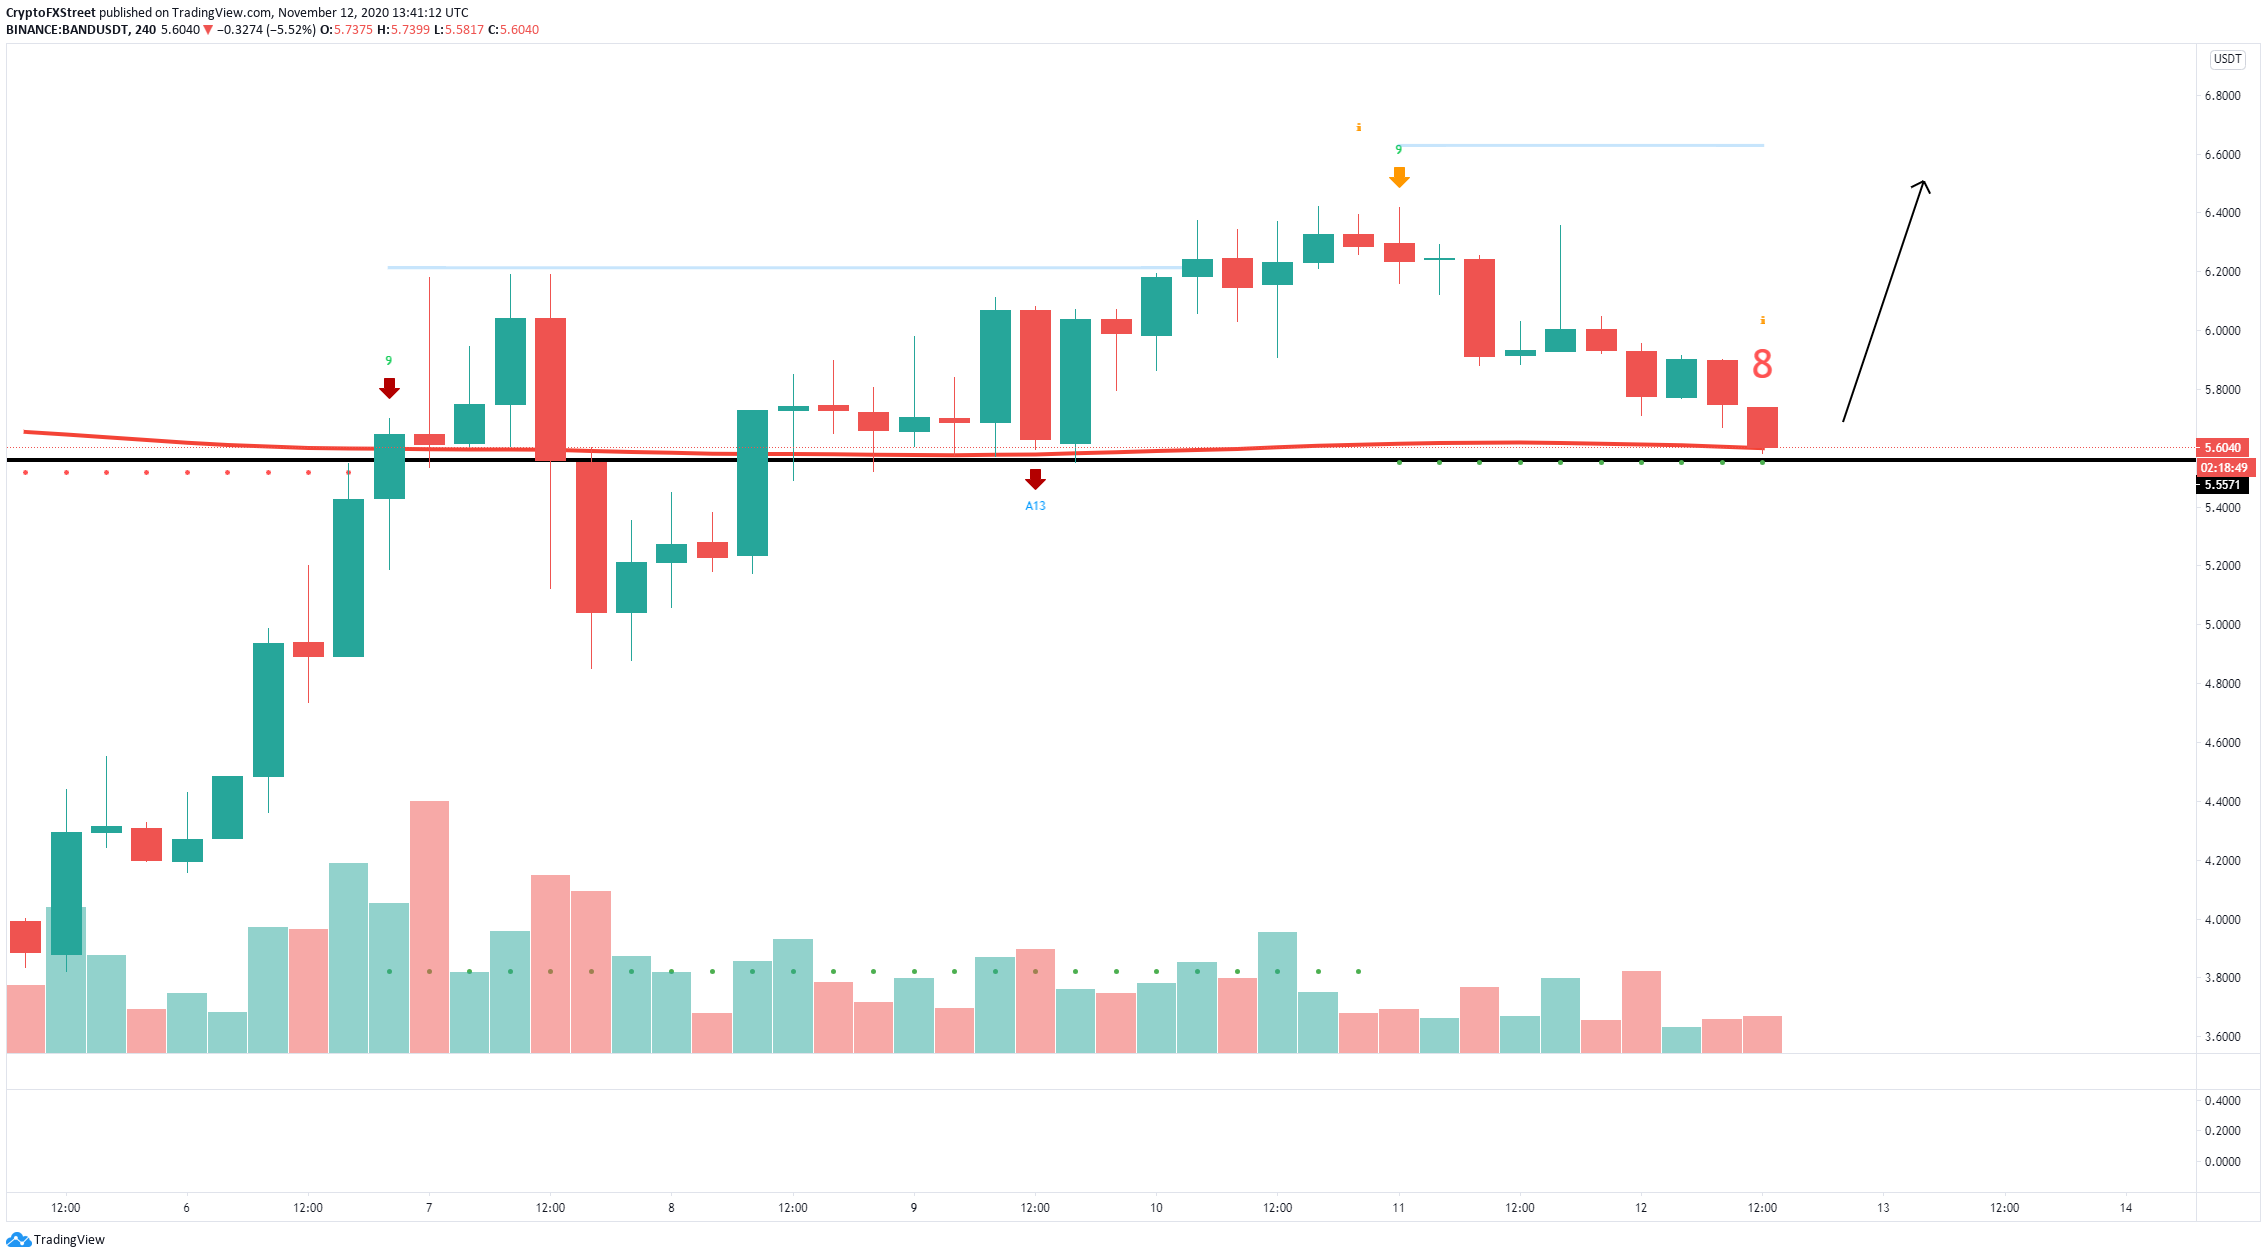
BAND/USD 4-hour chart
Bulls have extra support as the 200-SMA is also located at $5.61, adding more strength to the support level at $5.55. The In/Out of the Money Around Price (IOMAP) chart confirms this theory as it also shows a significant support area between $5.44 and $5.61.
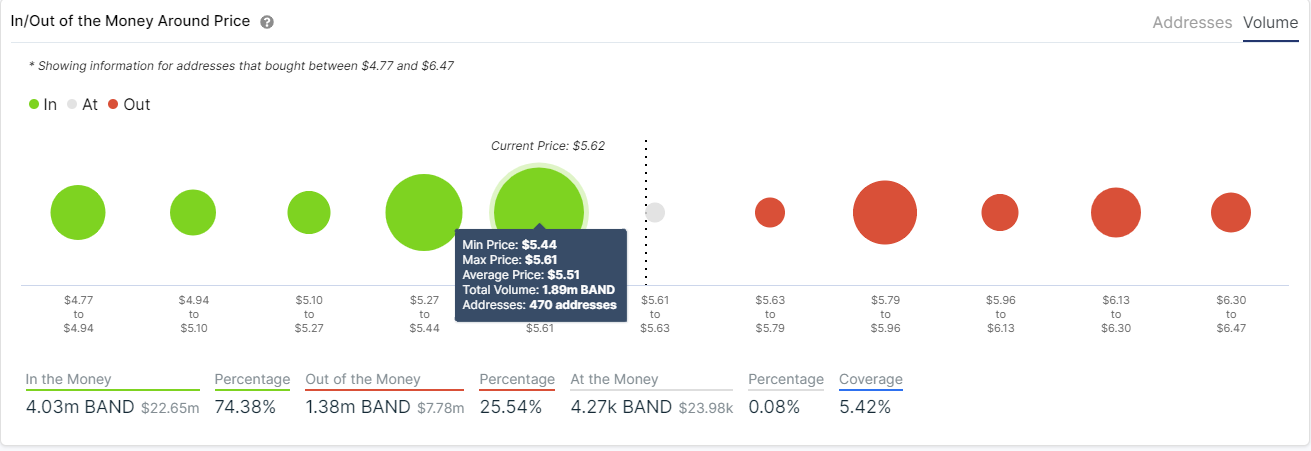
BAND IOMAP chart
Around 470 addresses purchased 1.89 million BAND inside the robust support range mentioned above. On the other hand, there seems to be very little resistance until $6.50, which would be the initial price target if the buy signal is confirmed.
However, because the support level at $5.55 is so strong, a breakdown from this point would be an extremely bearish signal, most likely driving Band Protocol price to the low of $4.85 established on November 7.
