- EOS price broke out of a descending wedge on the 4-hour chart, climbing 4% within hours.
- The digital asset is seeking more continuation to the upside.
EOS price was bounded inside a descending wedge formed on the 4-hour chart. The digital asset had a notable breakout several hours ago, jumping from $2.48 to $2.59 within hours. The initial price target for the bulls is $2.62.
Can the bulls keep up with the current pace?
The breakout of the descending wedge is a significantly bullish indicator in the short-term. Using the height of the pattern as a reference, the first key level seems to be at $2.62, which is the high established on November 7.
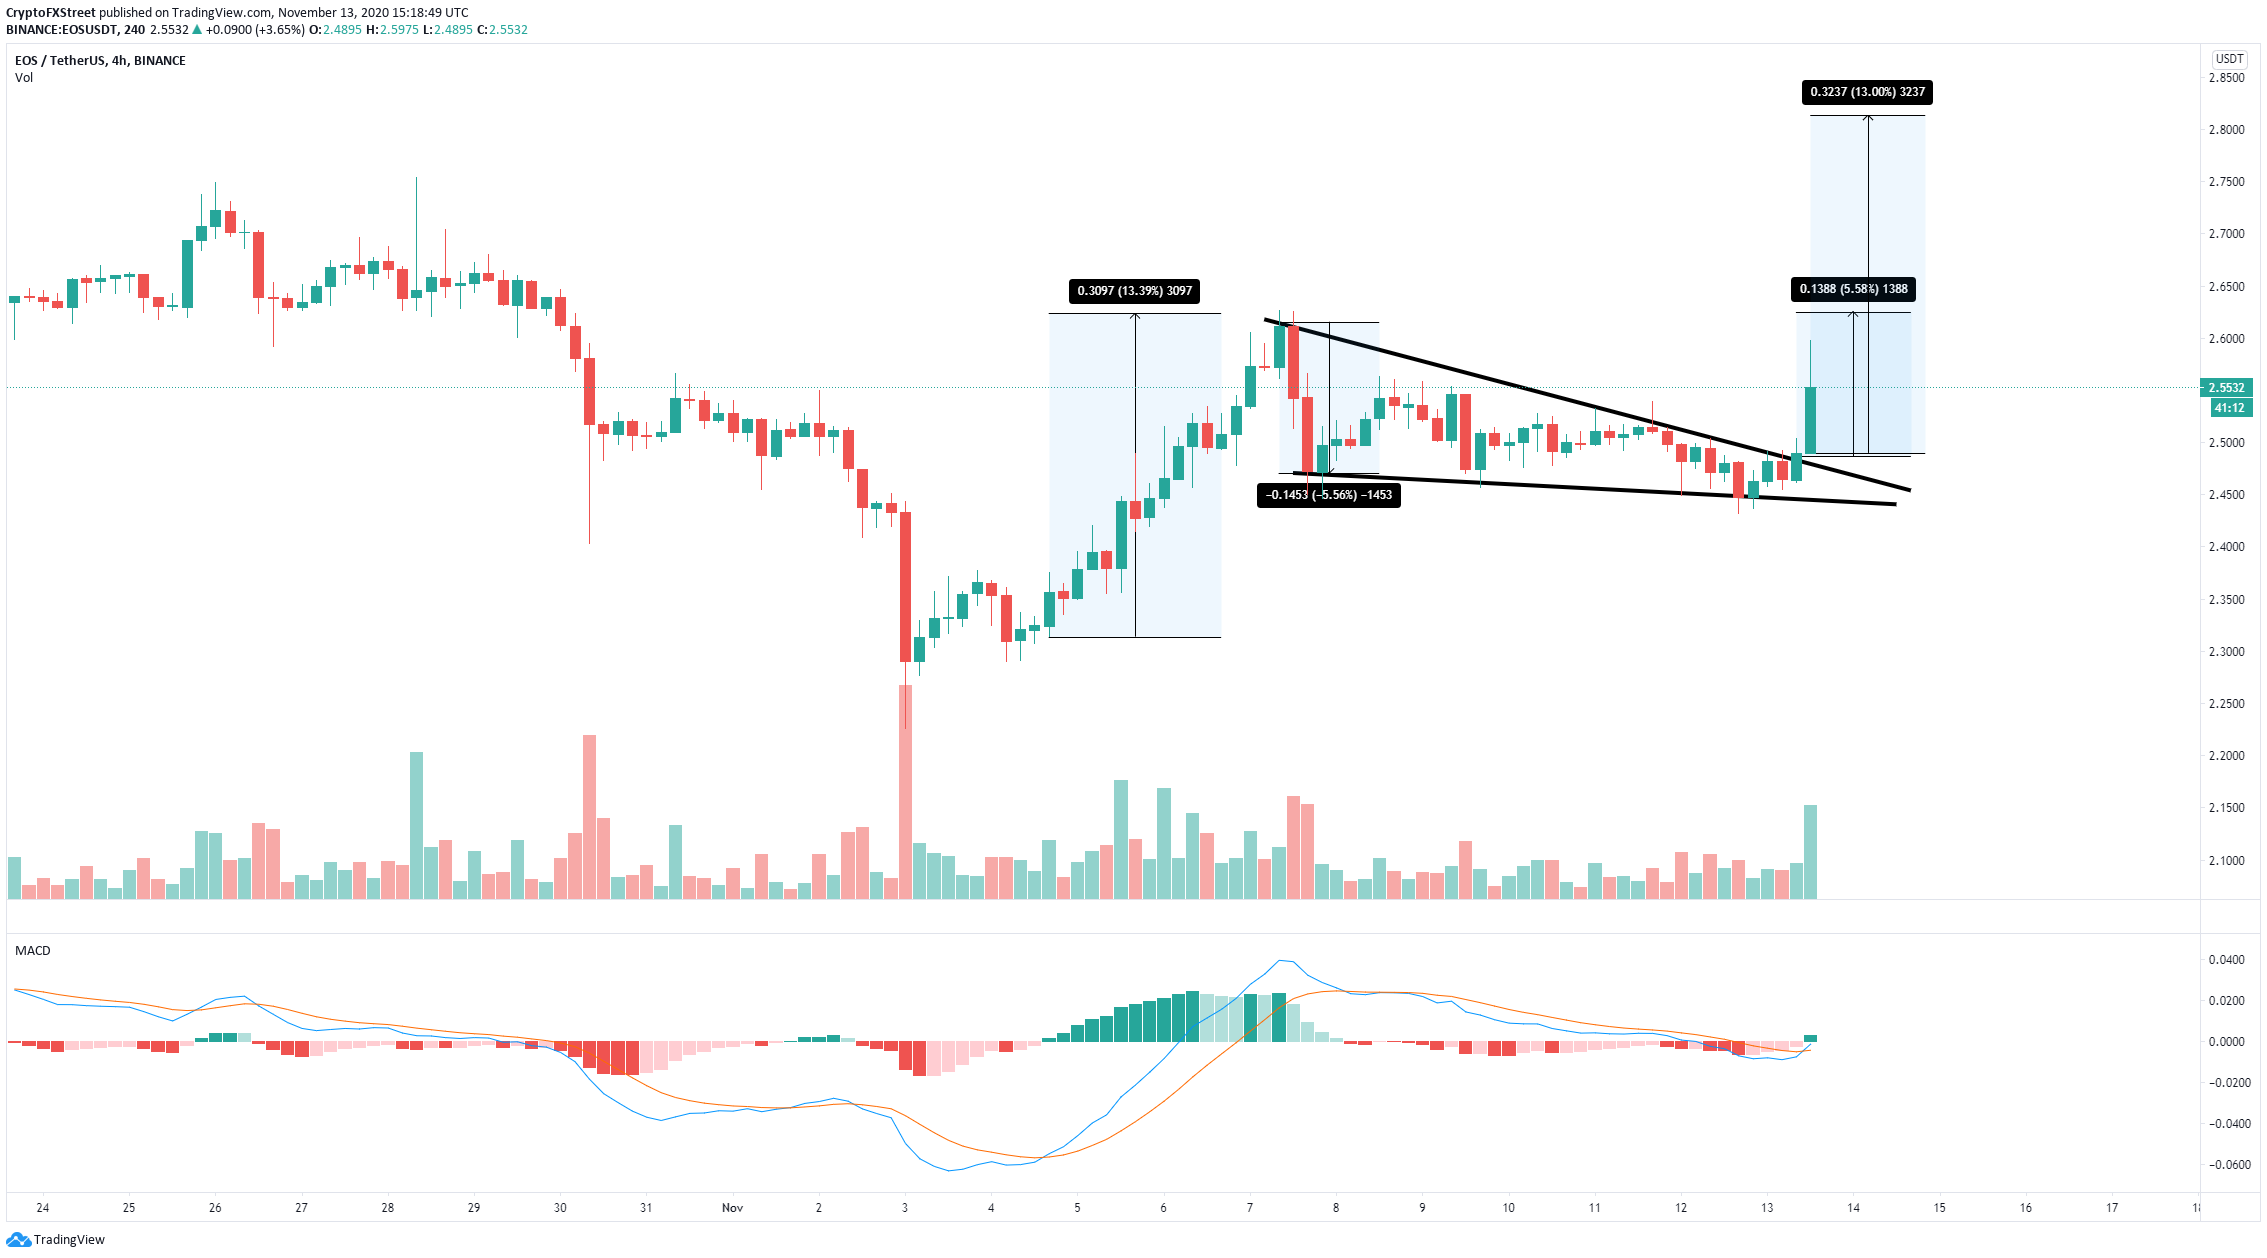
EOS/USD 4-hour chart
Additionally, the MACD just turned bullish again for the first time since November 4. The last bull cross took EOS from $2.13 to $2.62, seeing a 13% jump. Another 13% move would drive EOS price towards $2.81.
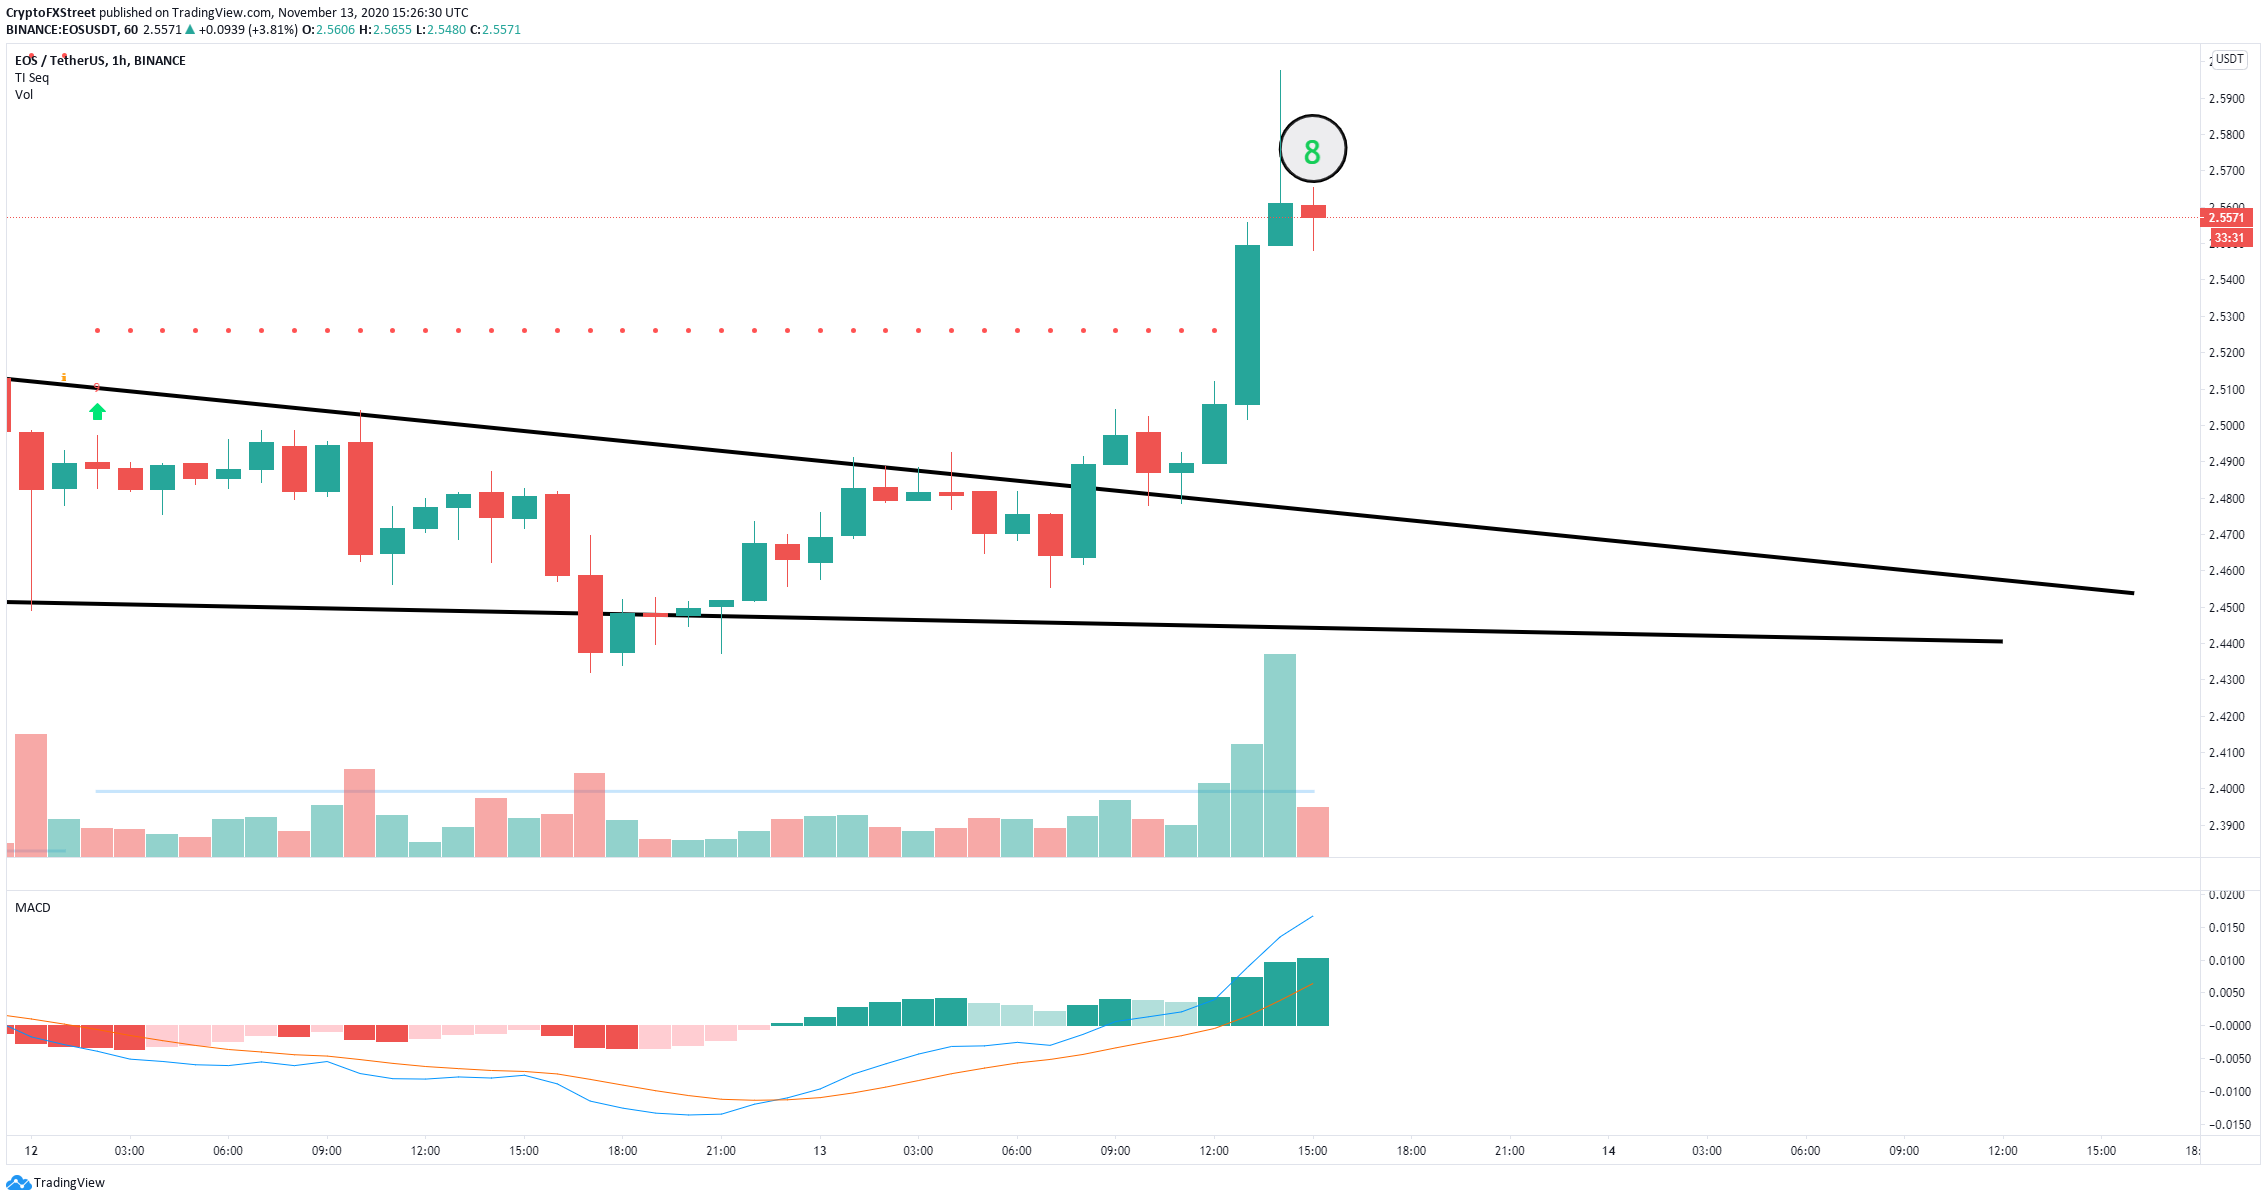
EOS/USD 1-hour chart
On the other hand, it seems that the TD Sequential indicator is about to present a sell signal on the 1-hour chart for EOS. It’s often the case that after a breakout from a wedge, the digital asset price comes back down to re-test the upper boundary. In this case, the price target would be $2.47.
