- XRP is rising for the third straight day on Sunday.
- $0.2900 aligns as the next target on the upside.
- Key support for Ripple is located near $0.2500.
Although Ripple failed to close above $0.2700 on Saturday, it posted gains for the second straight day and continued to edge higher on Sunday. As of writing, XRP was up 1.5% on a daily basis at $0.2720.
Daily close above $0.2700 to pave the way for more gains
The Fibonacci 38.2% retracement of the uptrend seen in July is currently located near $0.27 and XRP is testing this level for the second consecutive day. If Ripple manages to end the week above that level, the next Fibonacci retracement at $0.2900 could be the next target on the upside.
However, the Relative Strength Index (RSI) indicator on the daily chart is within a touching distance of 70. The last time the RSI rose above 70 back in mid-August, the price reversed its course and dropped from $0.3280 to $0.2320 in two weeks. In case a similar correction takes place, $0.2570 (100-day SMA) is the first support ahead of $0.2500, where the Fibonacci 50% retracement is located. If these levels fail to limit XRP’s losses, the outlook could turn bearish and the price could extend its slide to 200-day SMA and Fibonacci 61.8% retracement at $0.2350.
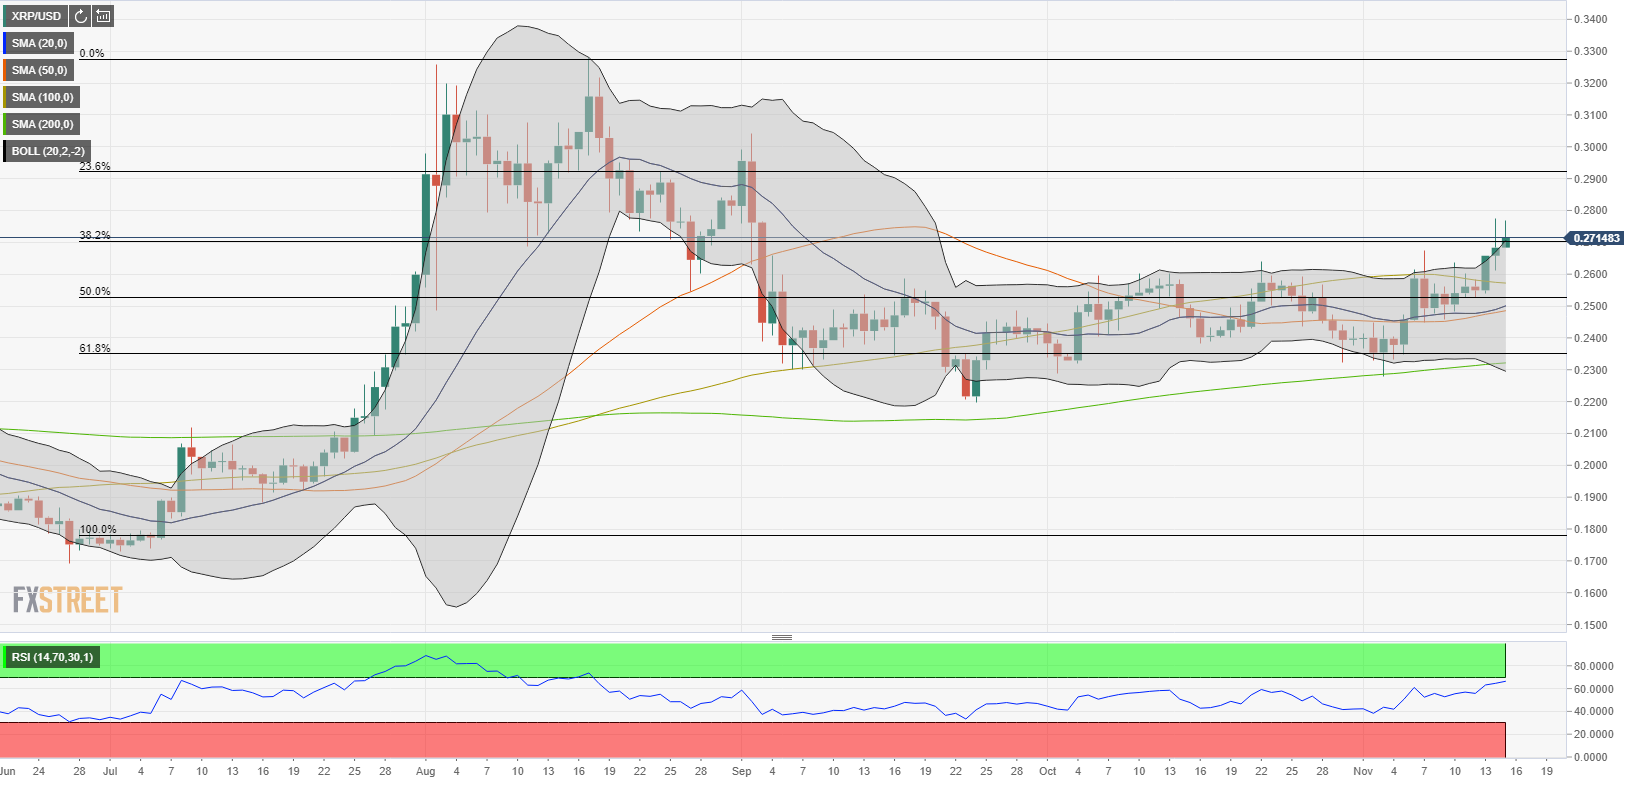 XRP daily chart
Ripple is trying to hold above a key Fibonacci resistance but technical indicators suggest that there could be a technical correction in the near-term. However, as long as the price stays above $0.2500, buyers might look to remain in control of the price action.
