- Bitcoin investors are almost at the euphoric level based on Glassnode’s Entity-adjusted LTH-NUPL.
- Usually, a massive correction comes after investors hit the euphoric level of the on-chain metric.
Bitcoin is trading closer to the all-time high now more than ever. Extreme speculation, fear, and greed are factors that have crept back to the market. Trading within a whisker of $19,000 has left many wondering just how far this rally can go.
Bitcoin gripped by investor excitement and extreme greed
The fear of missing out (FOMO) is another major factor behind the parabolic spike. As discussed on Monday, the resistance at $19,000 sends jitters among investors. Some have confidence that BTC will slice through and make its way to $20,000. On the other hand, some investors and traders fear that rejection at $19,000 may see Bitcoin slump to $14,000.
Bull markets are usually characterized by retracements, which mainly help establish key support levels where the next uptrends could start building. However, in recent weeks, Bitcoin has rallied consistently; thus, investors seem to have thrown caution out the window. Therefore, this article considers one of Glassnode’s key on-chain metrics to narrow down Bitcoin’s next move.
Understanding the Entity-adjusted LTH-NUPL
According to Glassnode, the Entity-adjusted LTH-NUPL is a better version of the Long-term Holders Net Unrealized Profit/Loss (LTH-NUPL). The metric measures the tractions between addresses belonging to the same entity, also called “in-house” transactions.
It is essential to note that the Entity-adjusted LTH-NUPL considers real economic activity. Therefore, providing investors with enhanced market signals in comparison to the other UTXO-based metrics.
The Entity-adjusted LTH-NUPL data is presented on a chart based on several investor emotional positions concerning price action, for instance, capitulation, hope – fear, optimism – anxiety, belief – denial, euphoria – greed. Capitulation suggests that prices are near rock bottom and a significant upward reversal is nigh.
Considering Bitcoin’s rally from July 2010 from $0.0505, the Entity-adjusted LTH-NUPL shows that hitting euphoria level, which comes after belief and denial, is a crucial indicator of massive correction likely to come into the picture. Note that euphoria levels can hold for a lengthy period, but they can also be extremely short.
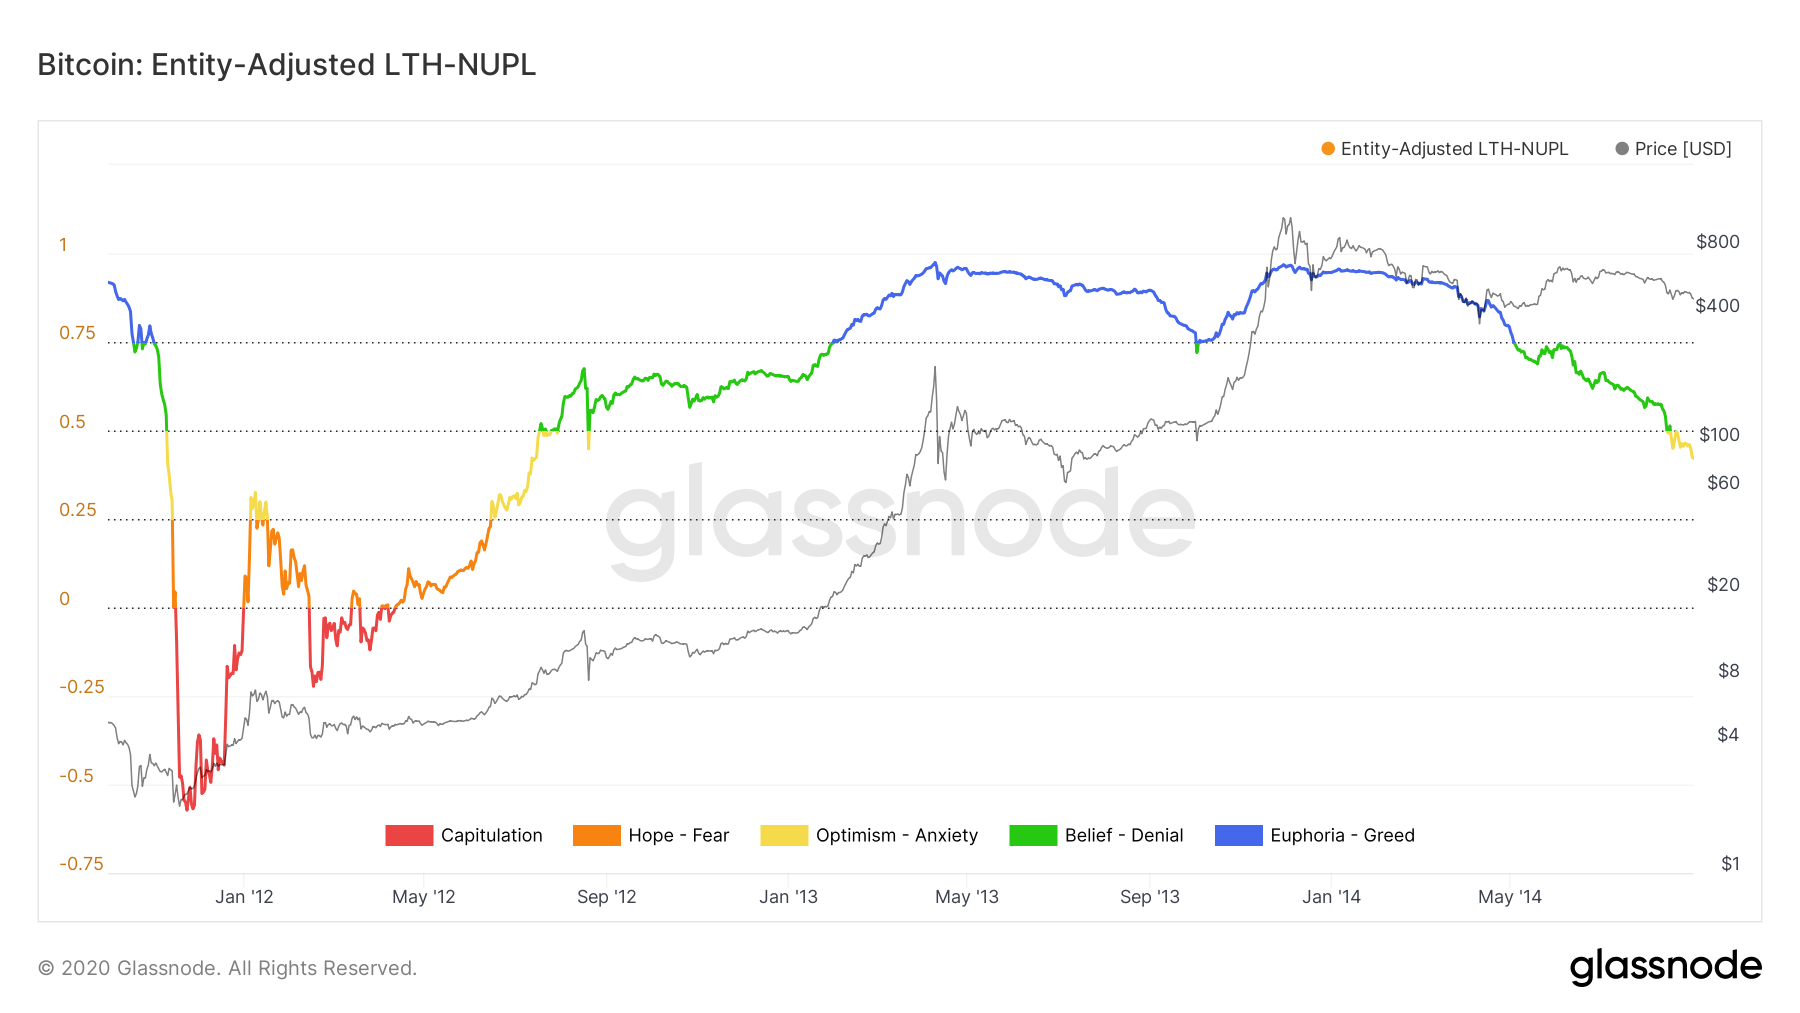
Bitcoin Entity-adjusted LTH-NUPL chart
A similar growth pattern can is spotted following the dip to $2 in 2011 followed by an impressive recovery to roughly $1,133 in 2014. Before euphoria sets in, the indicator shows that it is not too late to join the market. During euphoria, prices tend to hit a peak before retreating sharply.

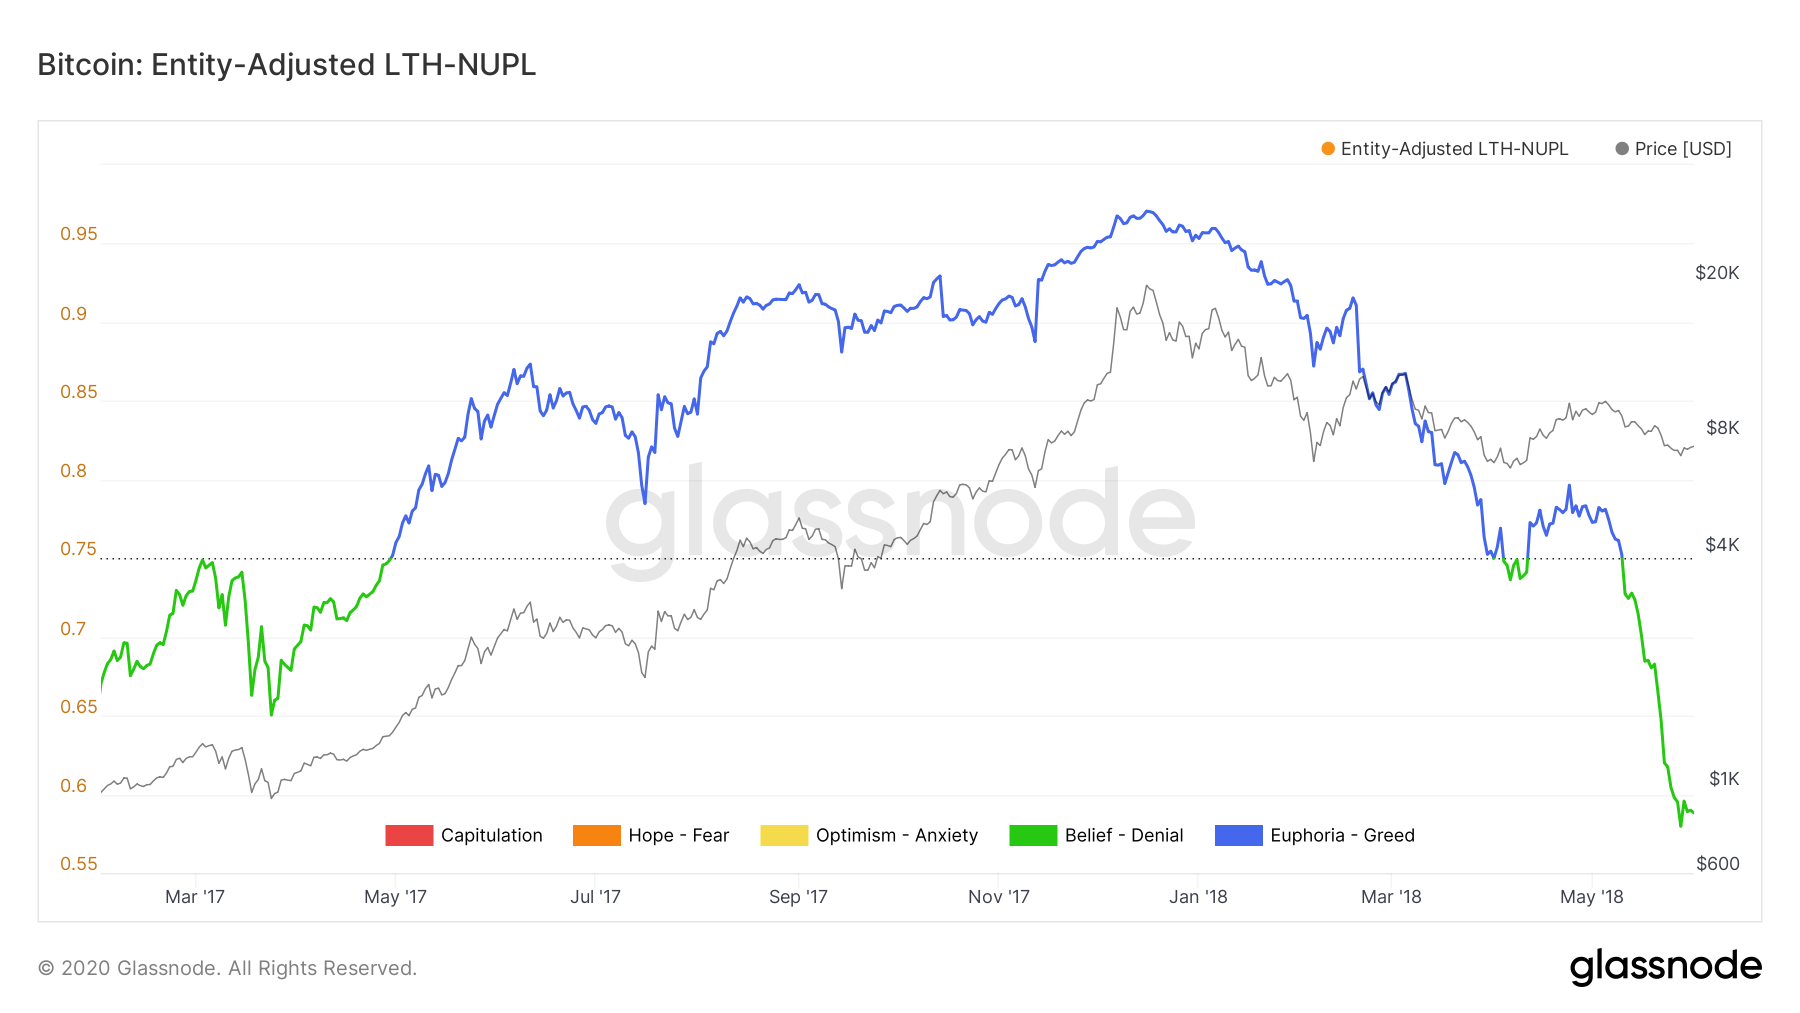
Bitcoin Entity-adjusted LTH-NUPL chart
The bull run in 2017 and early 2018 is also reinforced by the metric, suggesting that it is best to enter the market when the Entity-adjusted LTH-NUPL at the belief level. On the other hand, investors must be keen to exit when the euphoria index begins to retreat. It is essential to realize that Bitcoin hit an all-time high close to $20,000 in December 2017 and embarked on a significant downtrend to $3,800 in March 2019.
Bitcoin Entity-adjusted LTH-NUPL chart
A zoomed chart reveals Bitcoin hitting capitulation level in March 2020 after the pandemic-triggered crash. The flagship cryptocurrency has gone through most of the entity levels and is about to hit euphoric. A correction is expected to reach euphoria, leading to significant losses like the fall from June 2019 high close to $14,000 to March 2020 low of around $4,800.
-637417900323725766.png)
Bitcoin Entity-adjusted LTH-NUPL chart
The fear and greed index by Alternative shows Bitcoin holding at an extreme greed level of 88. The bellwether cryptocurrency has been stuck in excessive greed levels since October. In other words, speculation and the desire to capitalize on the rallying prices are the drivers of the bullish momentum. It also raises questions of whether Bitcoin can find formidable but higher support in a reversal.
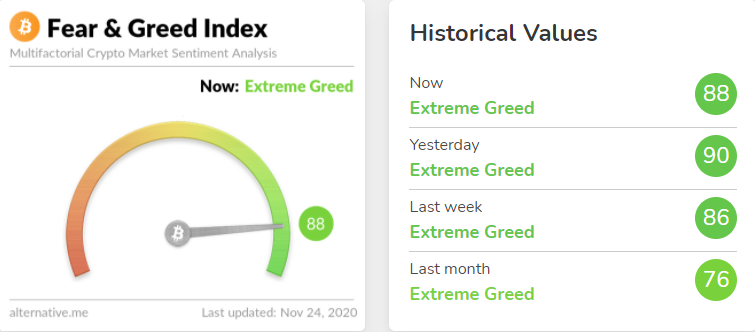
Bitcoin fear and greed index
Meanwhile, Bitcoin is trading at $18,385 after failing to hold above $18,500. Closing the day above this crucial level might help elevate Bitcoin above $19,000. However, a sideways trading action seems to be taking precedence, like the Relative Strength Index leveling motion above the midline.
%20(68)-637417900980190911.png)
BTC/USD 4-hour chart
It is worth noting that Bitcoin will abandon the mission to extend the uptrend above $19,000 if the seller congestion at $18,500 remains intact. A correction from the current price level may overshoot $18,000 and retest the support at the 50 Simple Moving Average.
In case of a breakdown, investors will rush to take profits, adding to the selling pressure. BTC/USD could spiral to $14,000, especially if the 100 SMA and the 200 SMA do little to stop the declines.
