- Cardano price is up 60% in the past five days, hitting a new 2020-high at $0.183.
- Following the massive rally, the digital asset is presenting some bearish signs in the short-term.
Cardano had a significant breakout on November 20 above a critical resistance level established at $0.112. After the massive rally, the digital asset shows some bearish signs on the daily and 12-hour charts.
Cardano price could be poised for a pullback to $0.14
On the 12-hour chart, the TD Sequential indicator has just presented a sell signal right after the peak of $0.183. The RSI is also extremely overextended, adding even more selling pressure on Cardano.
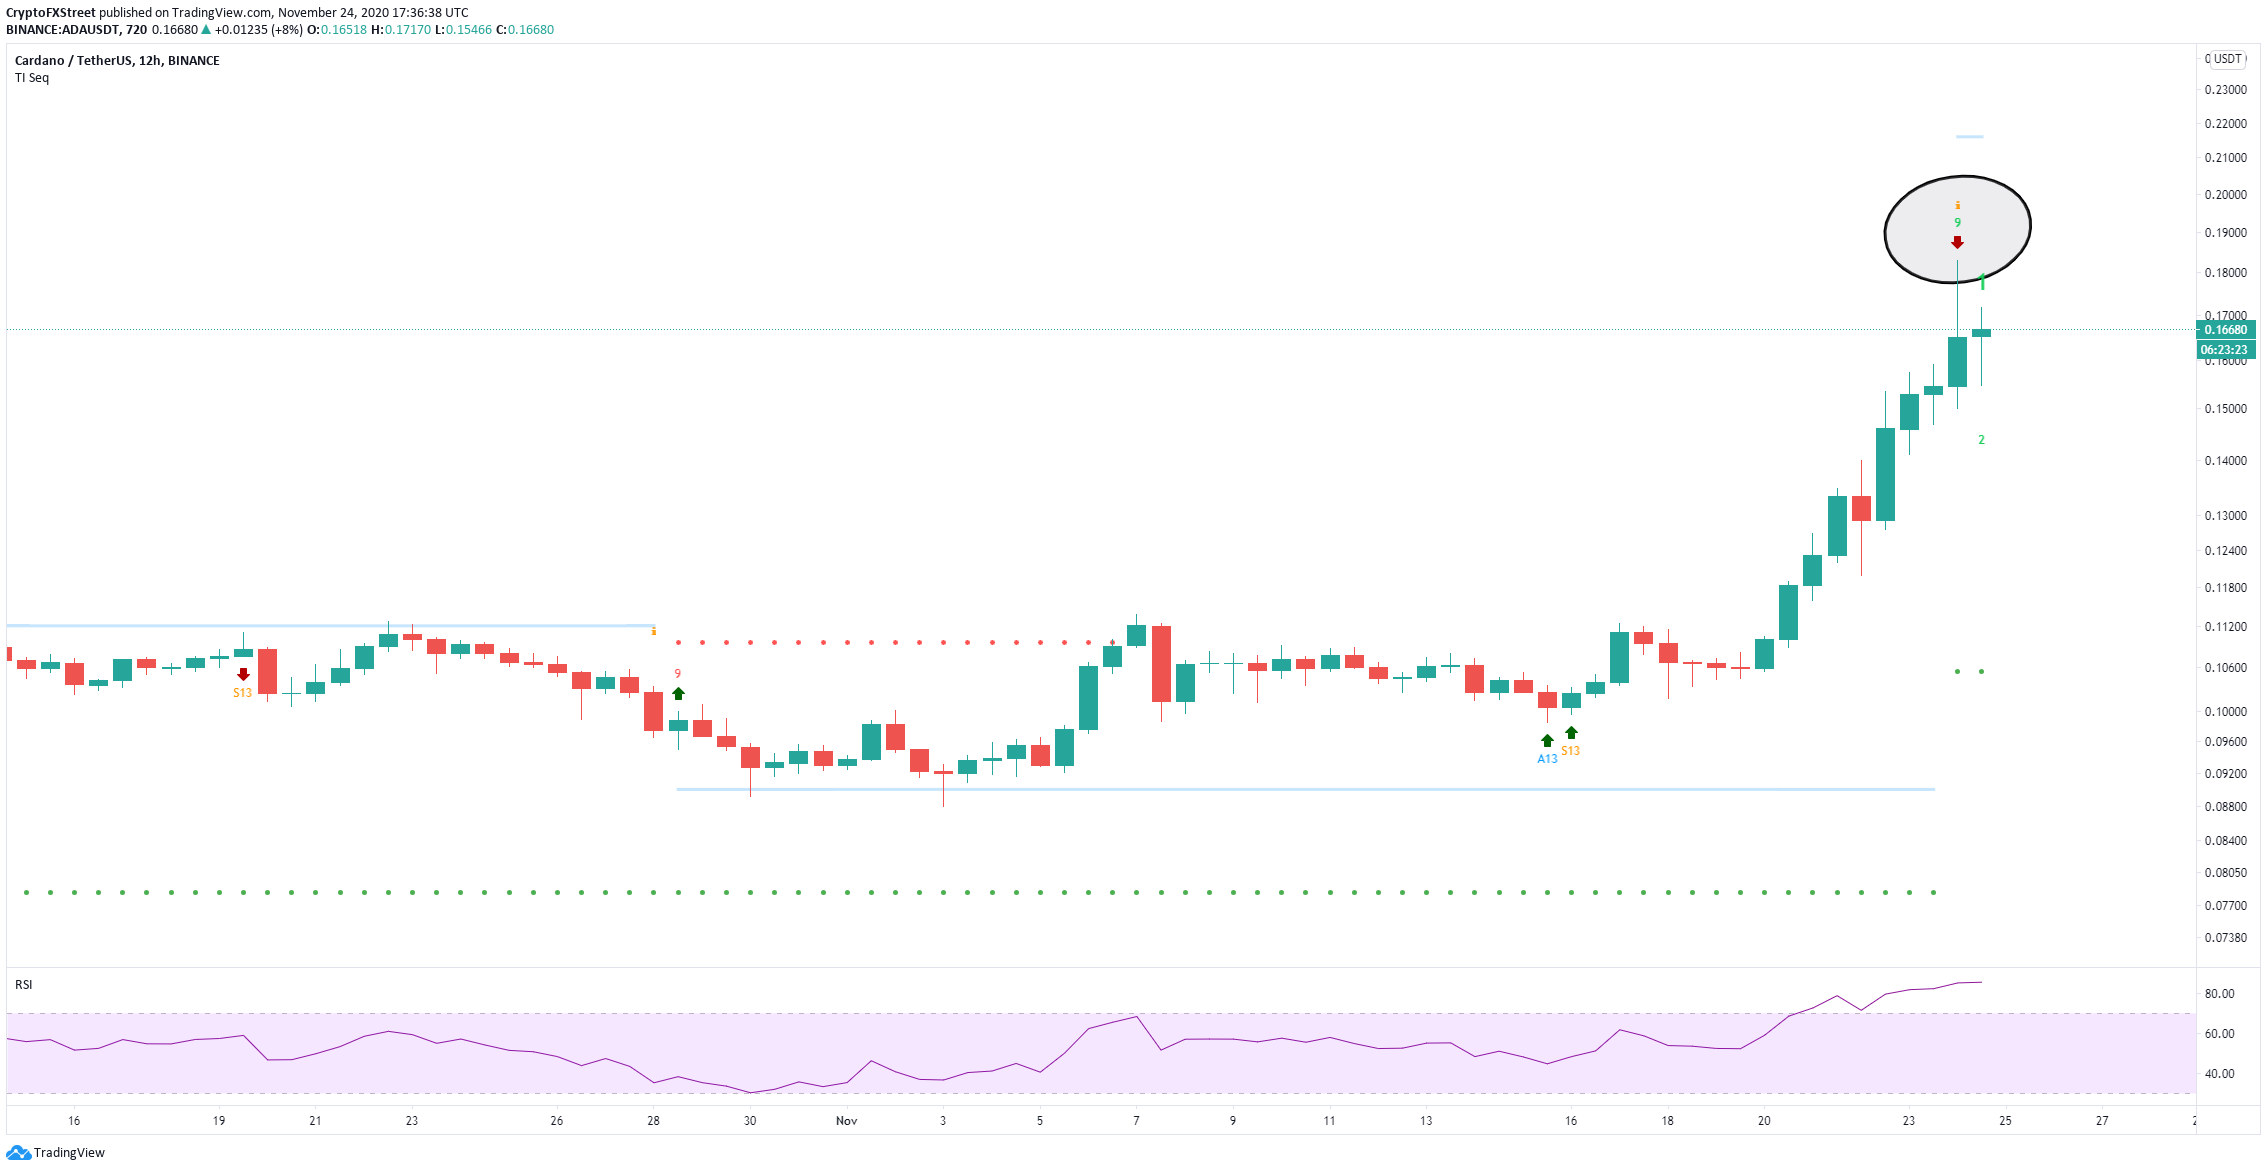
ADA/USD 12-hour chart
Similarly, on the daily chart, the TD Sequential is on the verge of presenting the same sell signal. Using the Fibonacci Retracement tool, we can determine some potential bearish price targets in the short-term if the sell signal is validated.
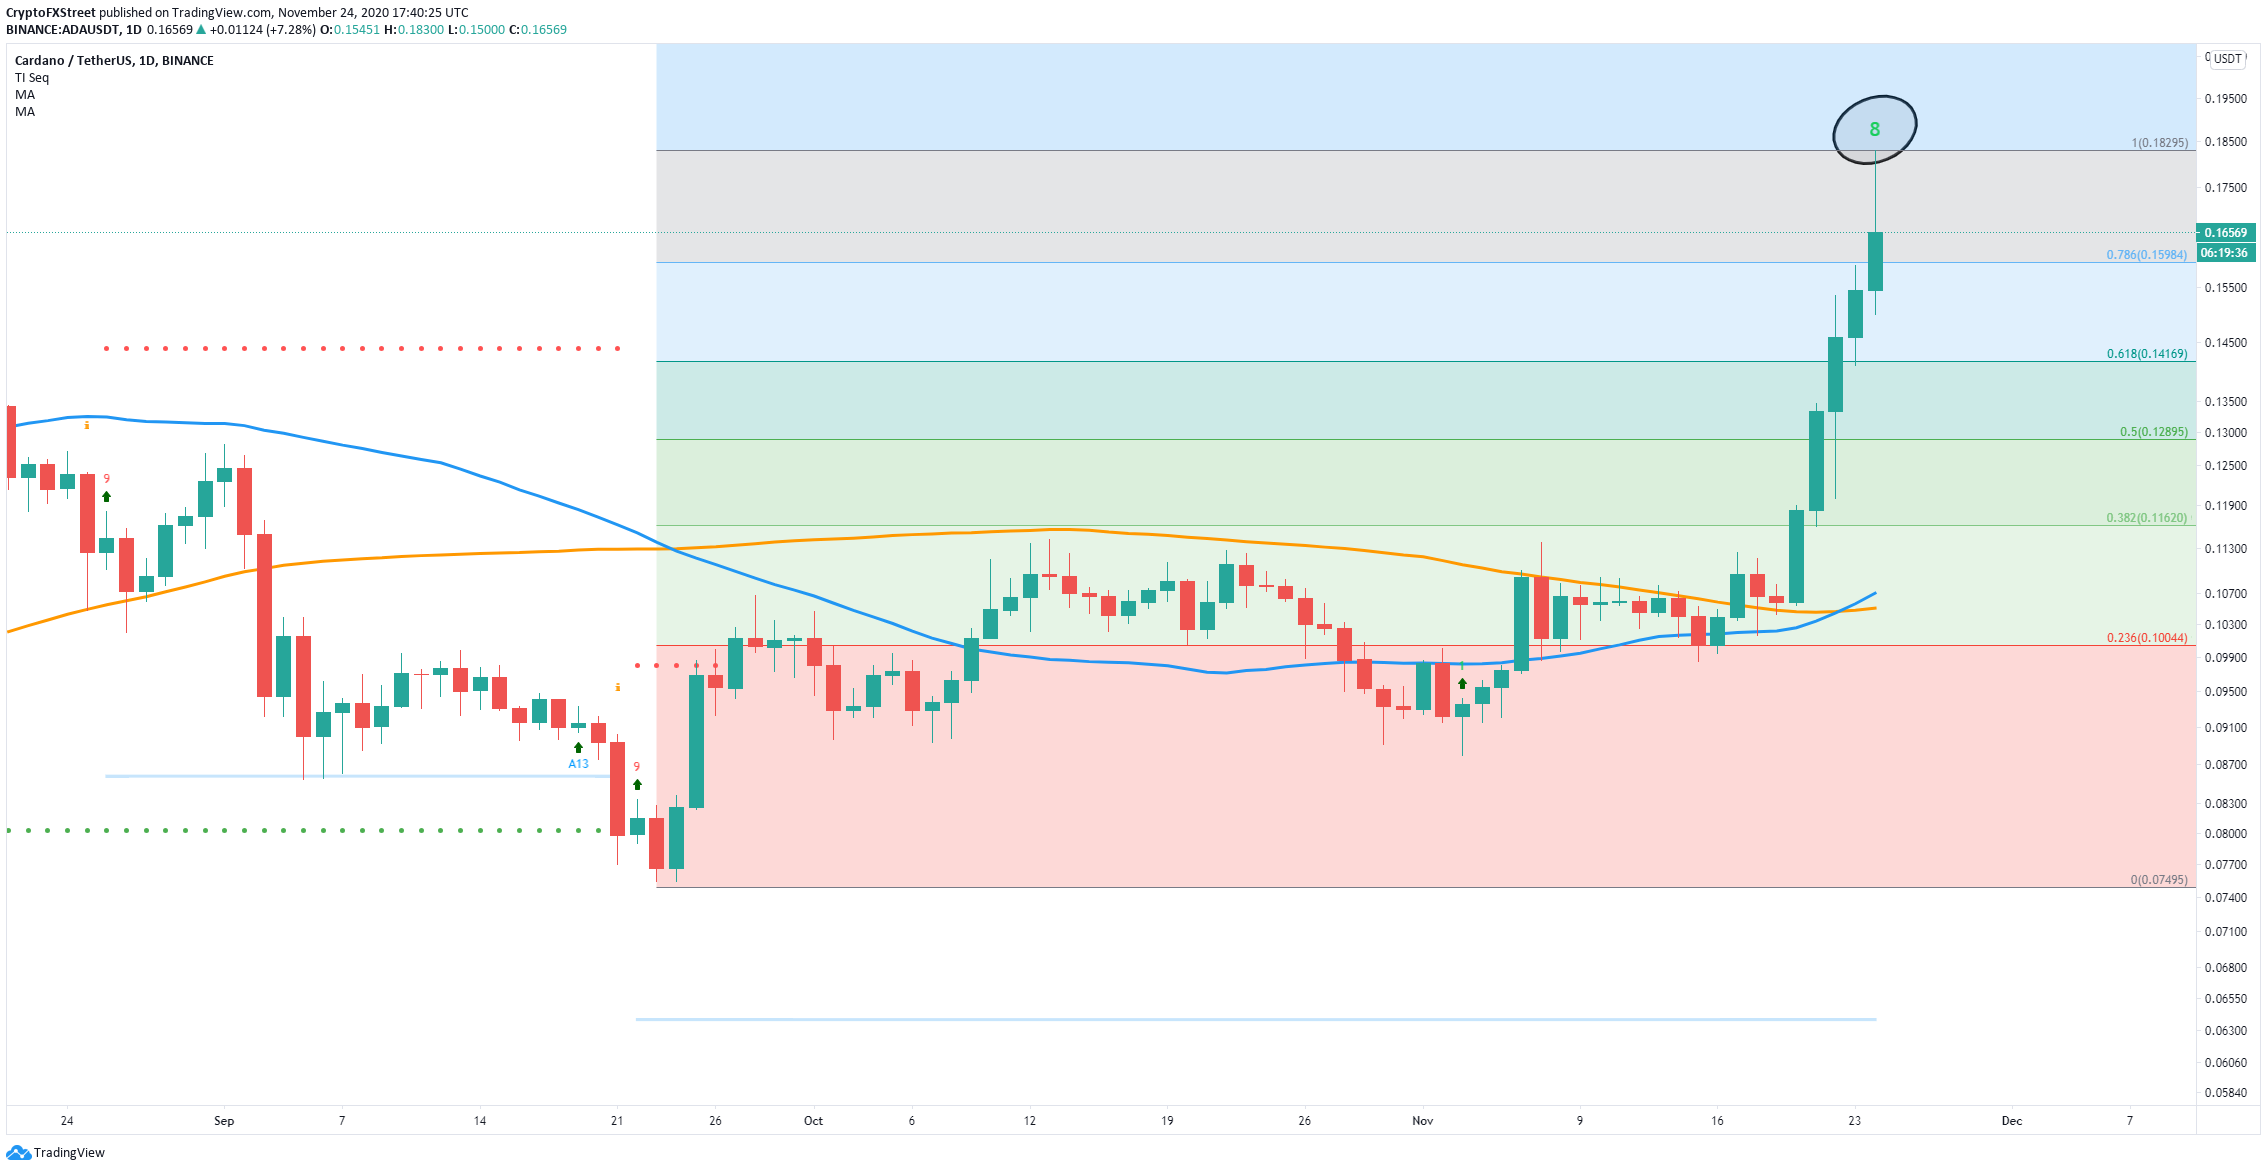
ADA/USD daily chart
The nearest support level seems to be $0.141, which is the 0.618 Fib level. The next significant point is $0.128, followed by $0.116, and finally the area between $0.105 and $0.1, which coincides with the 50-SMA and the 100-SMA as well as the 0.236 Fib level.
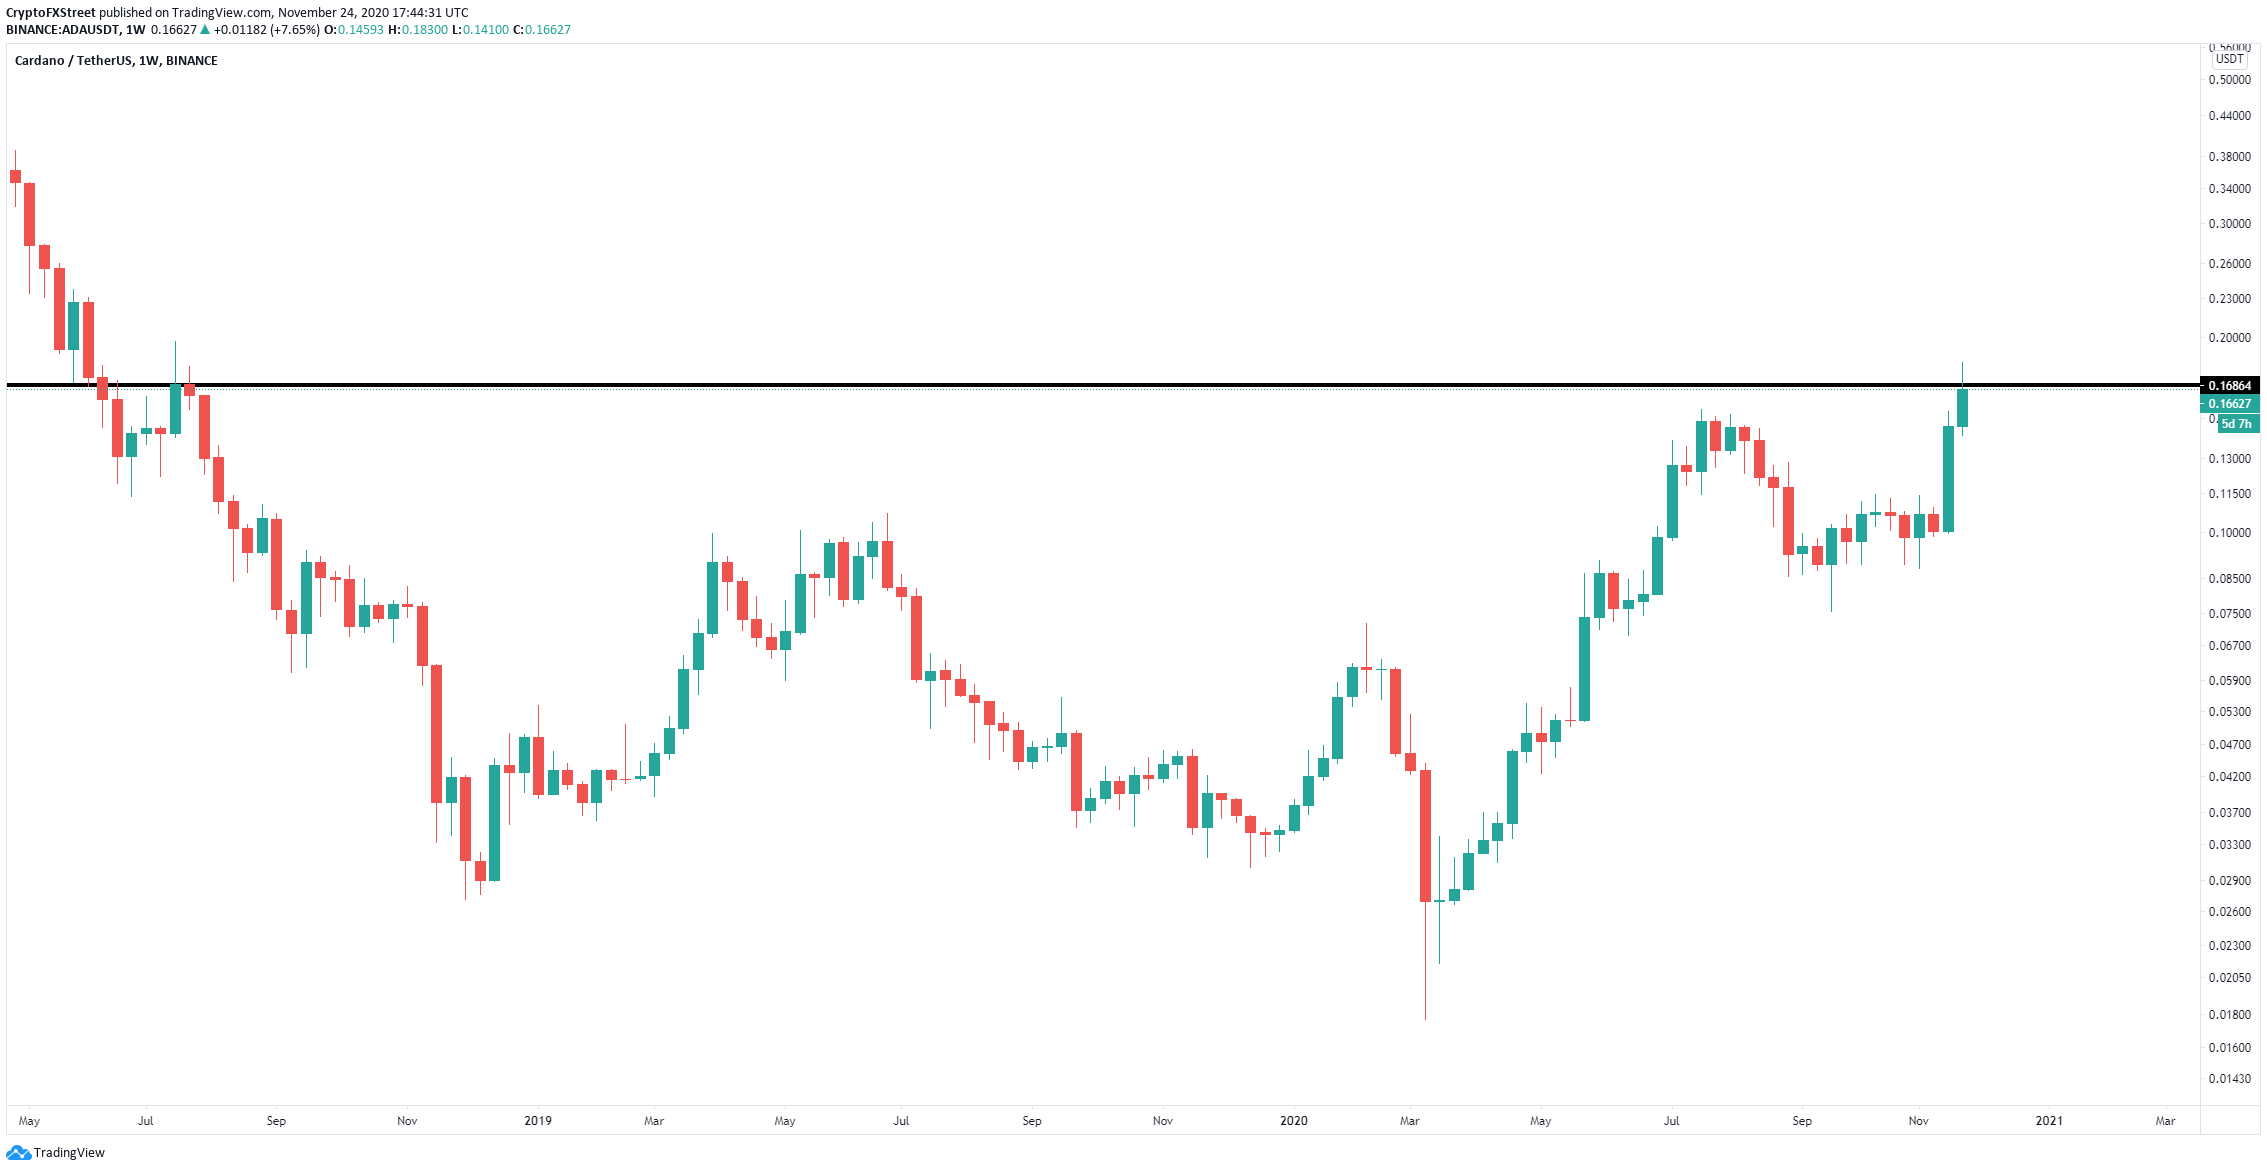
ADA/USD weekly chart
On the other hand, Cardano price is only facing a major resistance level at $0.168 on the weekly chart. A breakout above this critical level can quickly drive Cardano price towards the next level at $0.2248.
