- The cryptocurrency market suffered a significant crash this week, but investors seem to be ready to buy the dip.
- Bloomberg’s latest report suggests Bitcoin is on its way towards a new all-time high.
Despite the major sell-off witnessed this week, many investors and media publications remain bullish on Bitcoin. Additionally, the number of stablecoins going towards exchanges surged significantly in the past 24 hours according to recent statistics.
Vital signs indicate investors buying the dip
One of the most significant indicators that show investors are very interested in buying Bitcoin’s dip is the amount of stablecoins inflow to exchanges. In the past 24 hours, more than $721 million USDT were sent to exchanges, $316 million USDC, $229 million DAI, and $46.7 million TUSD, all monthly highs.
The USD-pegged stablecoin by Binance, BUSD, had its second-largest single-day exchange inflow at $85.2 million. This is largely considered a bullish sign, although some of these funds could be used for margin trading to short.
A recent article by Bloomberg states that Bitcoin is far more liquid now despite the crash and that it is not a sign of a speculative bubble but relatively normal growth. It also mentions the significant increase in the number of Bitcoin users, another notable bullish sign.
Meanwhile, Seeking Alpha, a research and financial markets platform, believes the aggressive 16% correction seen this week does not resemble the ones in 2017. They also point out that the number of searches in Google for Bitcoin in December 2017 remains astronomically higher than the current ones. This would indicate that the market is not yet in a full FOMO position.
BTC/USD technical view
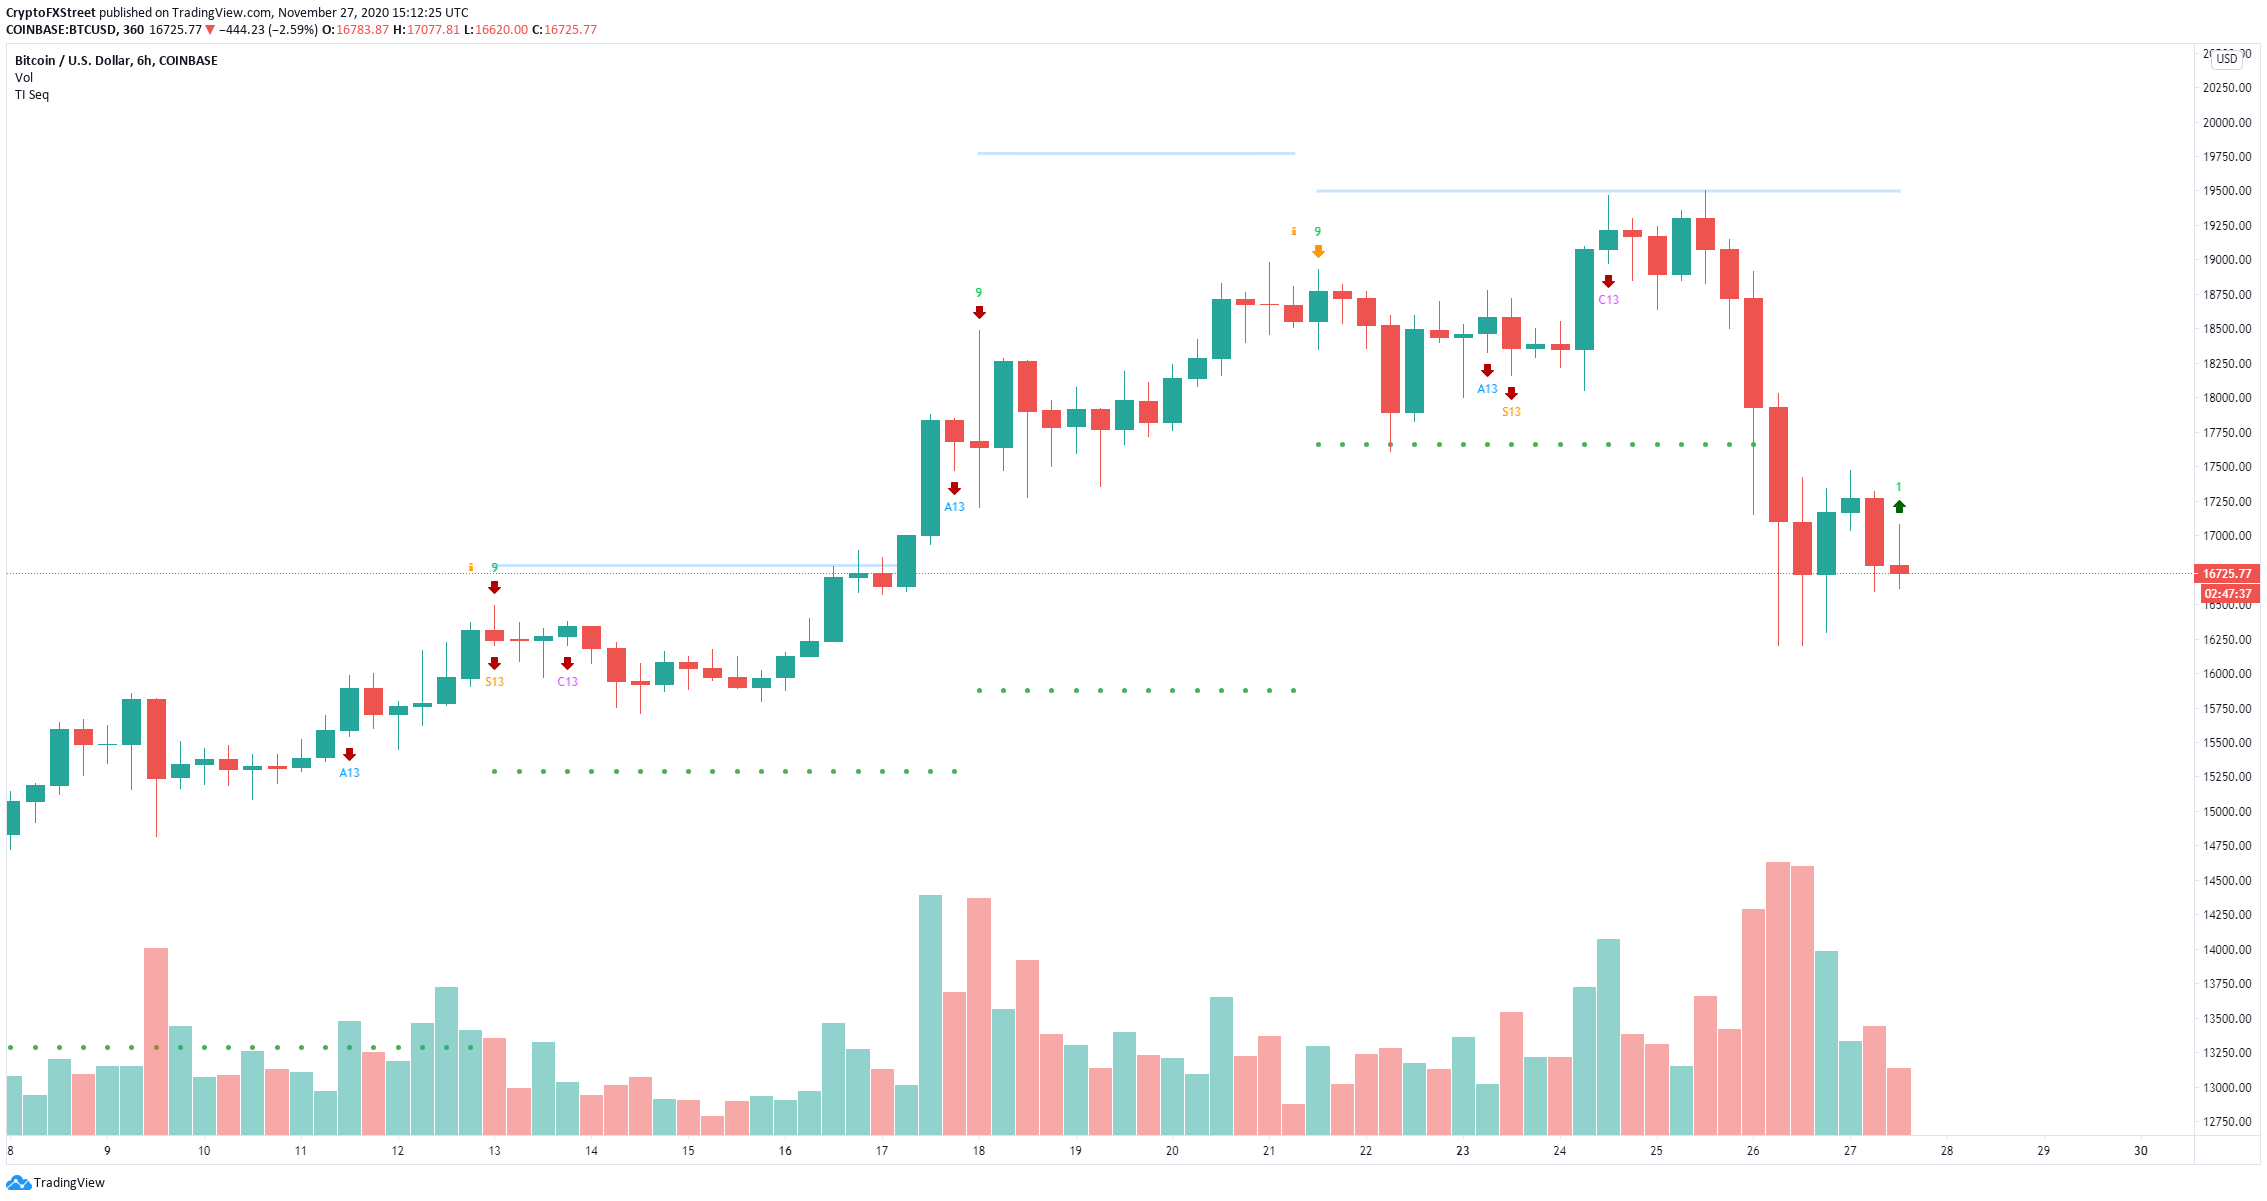
BTC/USD 6-hour chart
From a technical perspective, on the 6-hour chart, the TD Sequential indicator has just presented a buy signal – in the form of a red nine candle – for the first time in months.
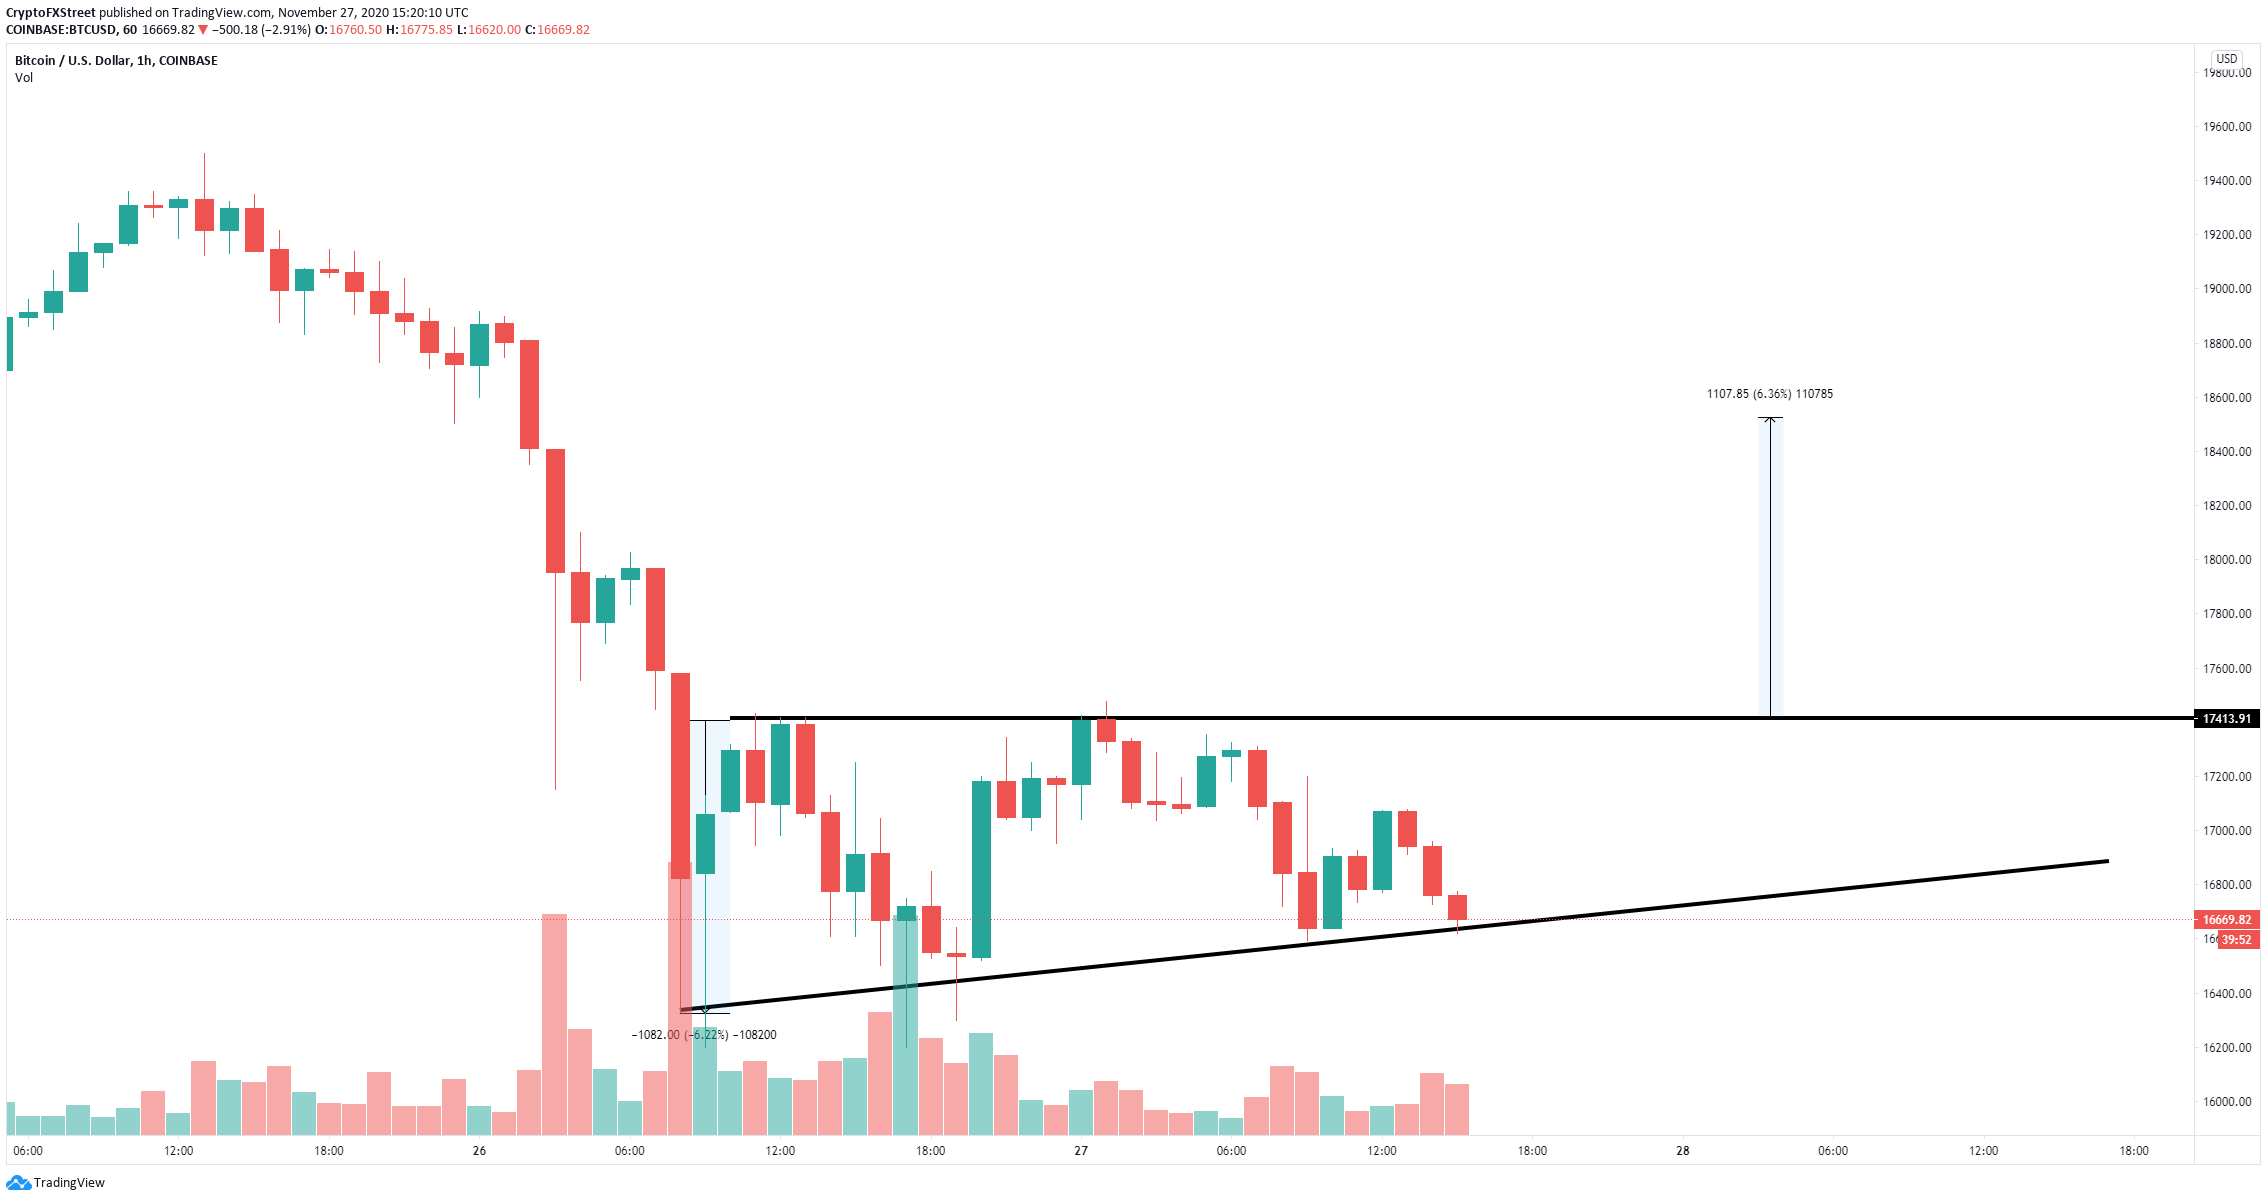
BTC/USD 1-hour chart
On the 1-hour chart, it seems that Bitcoin price has formed an ascending triangle pattern with the upper trendline resistance at $17,413. The digital asset is currently bouncing from the lower boundary, currently at $16,600, and aims to reach the top. A breakout above $17,413 would drive Bitcoin price towards $18,500.
