- Ripple price seems to be contained inside a symmetrical triangle pattern on the 4-hour chart.
- A breakout is nearby if the 50-SMA support level continues holding.
XRP has been trading sideways for the past three days consolidating after establishing a new 2020-high at $0.78. Bulls are holding a crucial support level in the short-term, which gives them better odds to see a breakout in the next few hours.
Ripple price on the verge of a breakout or breakdown
On the 4-hour chart, XRP has established a symmetrical triangle which seems to favor the bulls as they have been holding the 50-SMA support level. The upper trendline is located at around $0.65 while the current price is $0.634.
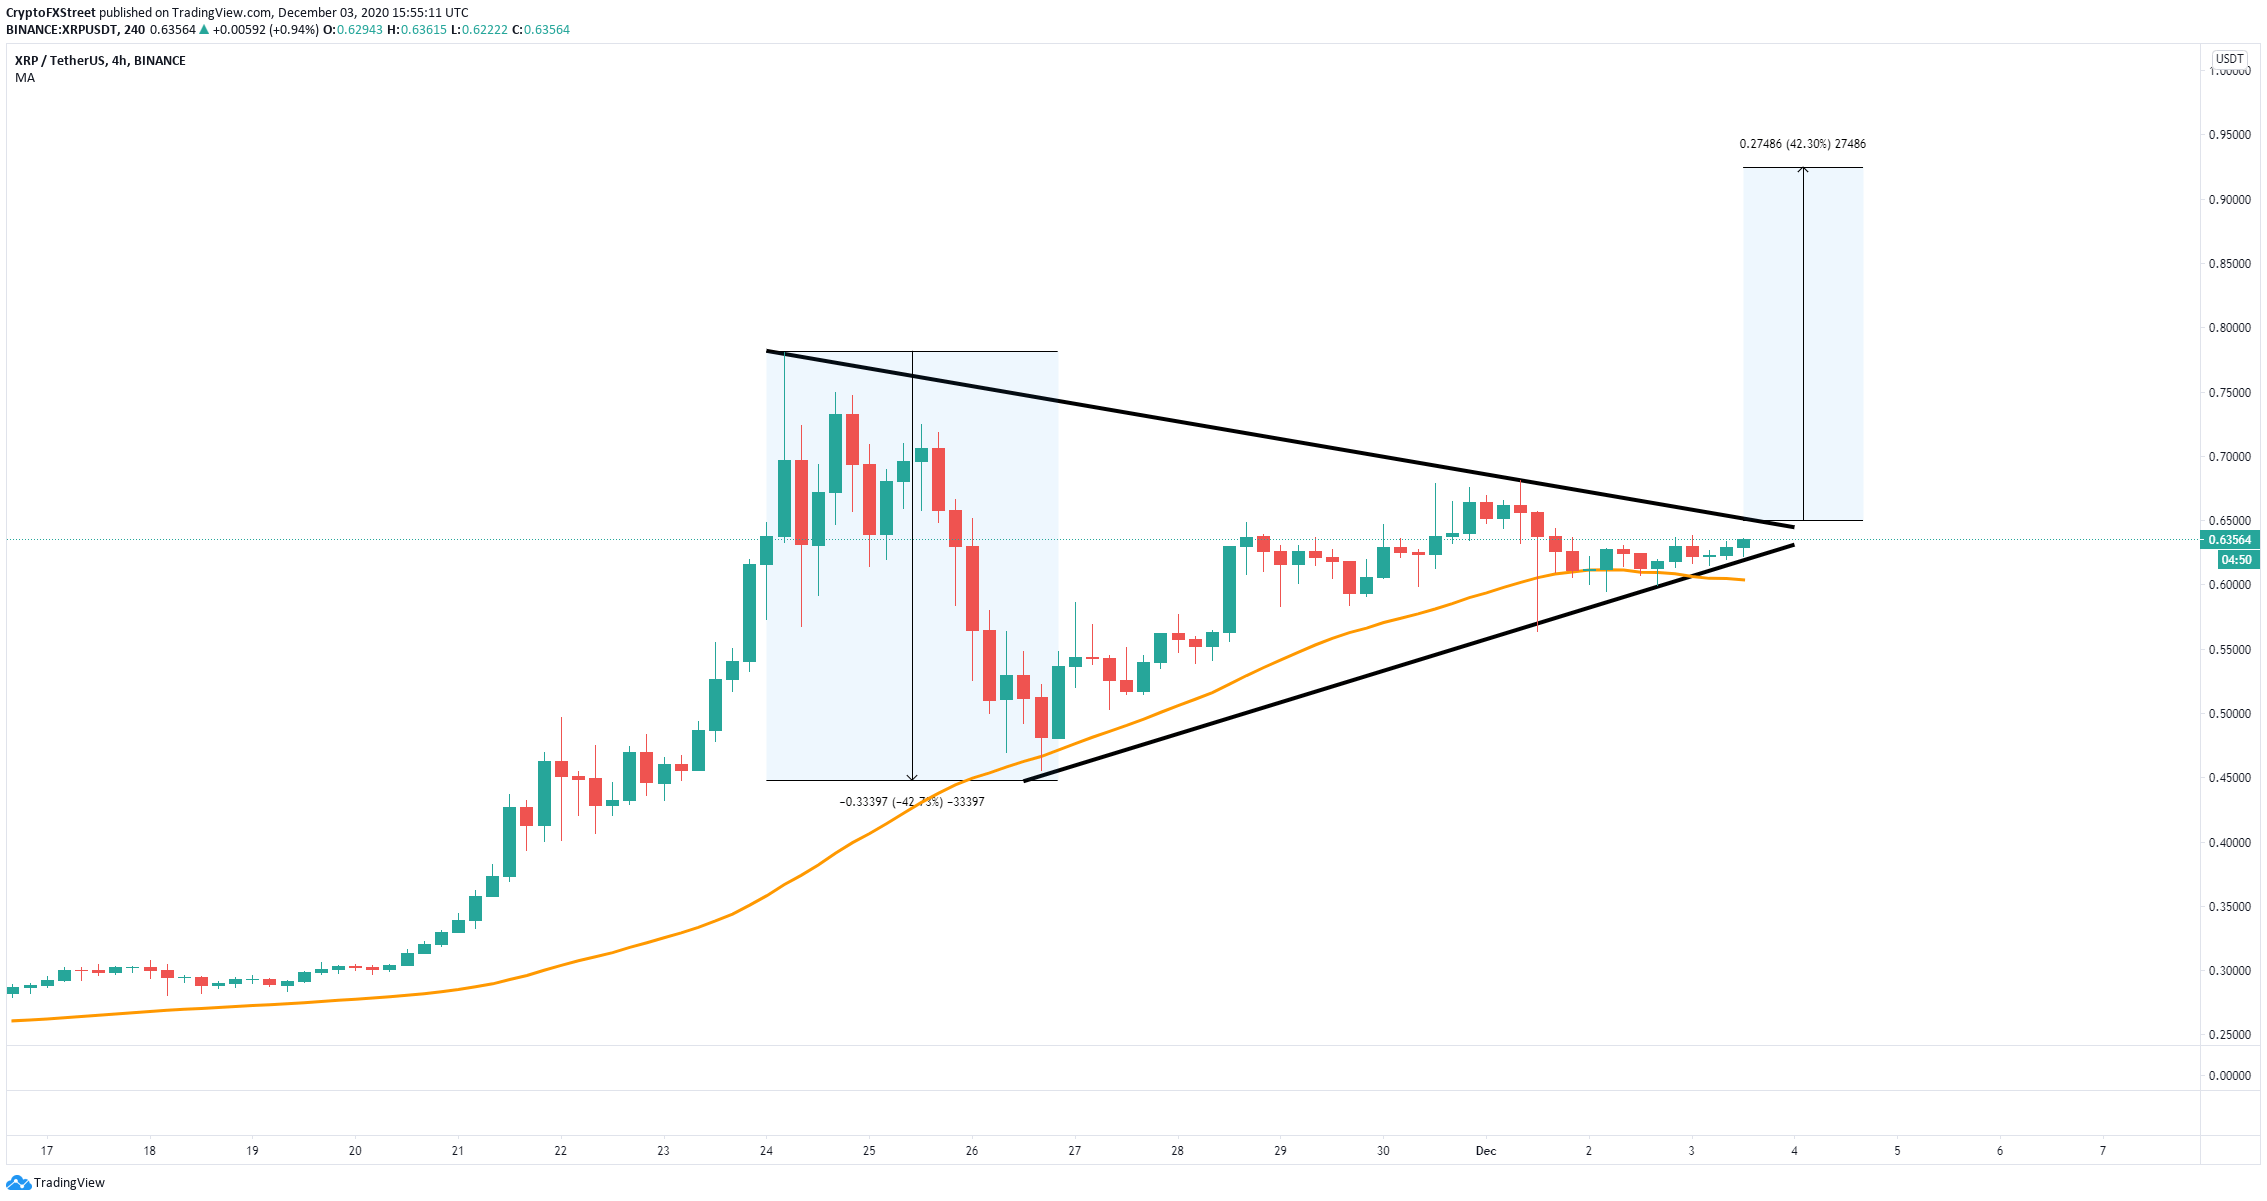
XRP/USD 4-hour chart
A breakout above the upper boundary of the pattern can quickly drive Ripple price towards a new 2020-high above $0.90 using the height of the triangle as a reference. Bulls need to hold the 50-SMA to see the breakout.
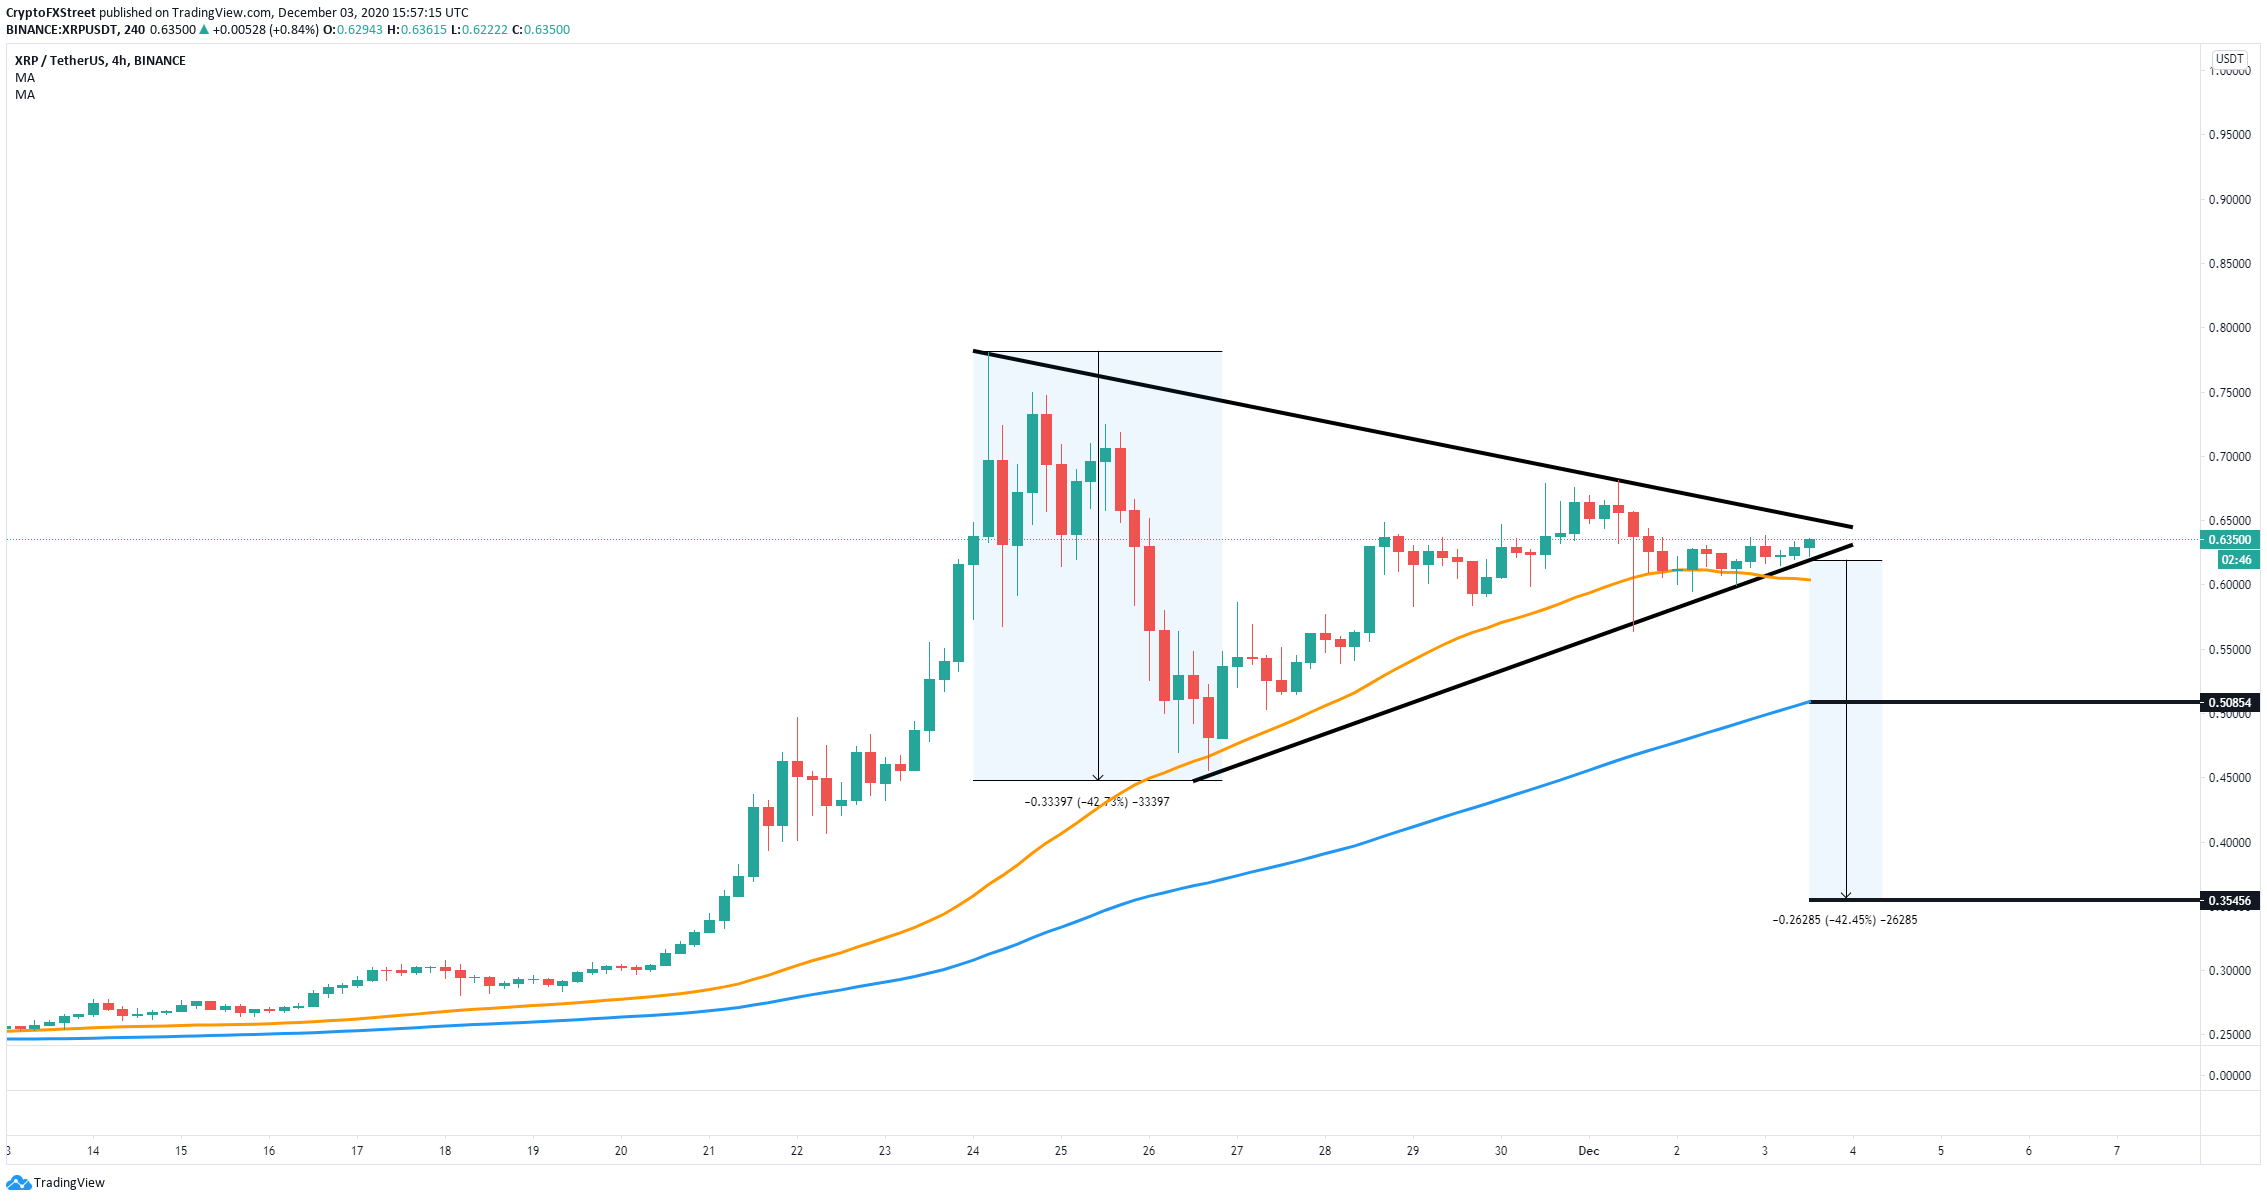
XRP/USD 4-hour chart
On the other hand, a breakdown below the lower trendline of the pattern at $0.62 and failure to hold the 50-SMA support can push Ripple price towards the psychological support level at $0.5 and as low as $0.35 in the longer-term.
