- Zilliqa price remains inside a robust daily uptrend fishing for higher highs.
- There are several indicators showing a potential pullback in the short-term before continuation of the uptrend.
Zilliqa is up by more than 170% in the past two months and its trading at $0.0322 inside a strong daily uptrend way above the 50-SMA or the 100-SMA. The digital asset seems to be pulling back strongly after a sell signal was presented on the daily chart.
Zilliqa price faces strong selling pressure in the short-term
The TD Sequential indicator presented a sell signal on December 6 which seems to be getting bearish continuation in the past 24 hours. The next bearish price target seems to be located at $0.0246 which is the 0.5 Fib retracement level and also the 50-SMA support level on the daily chart.
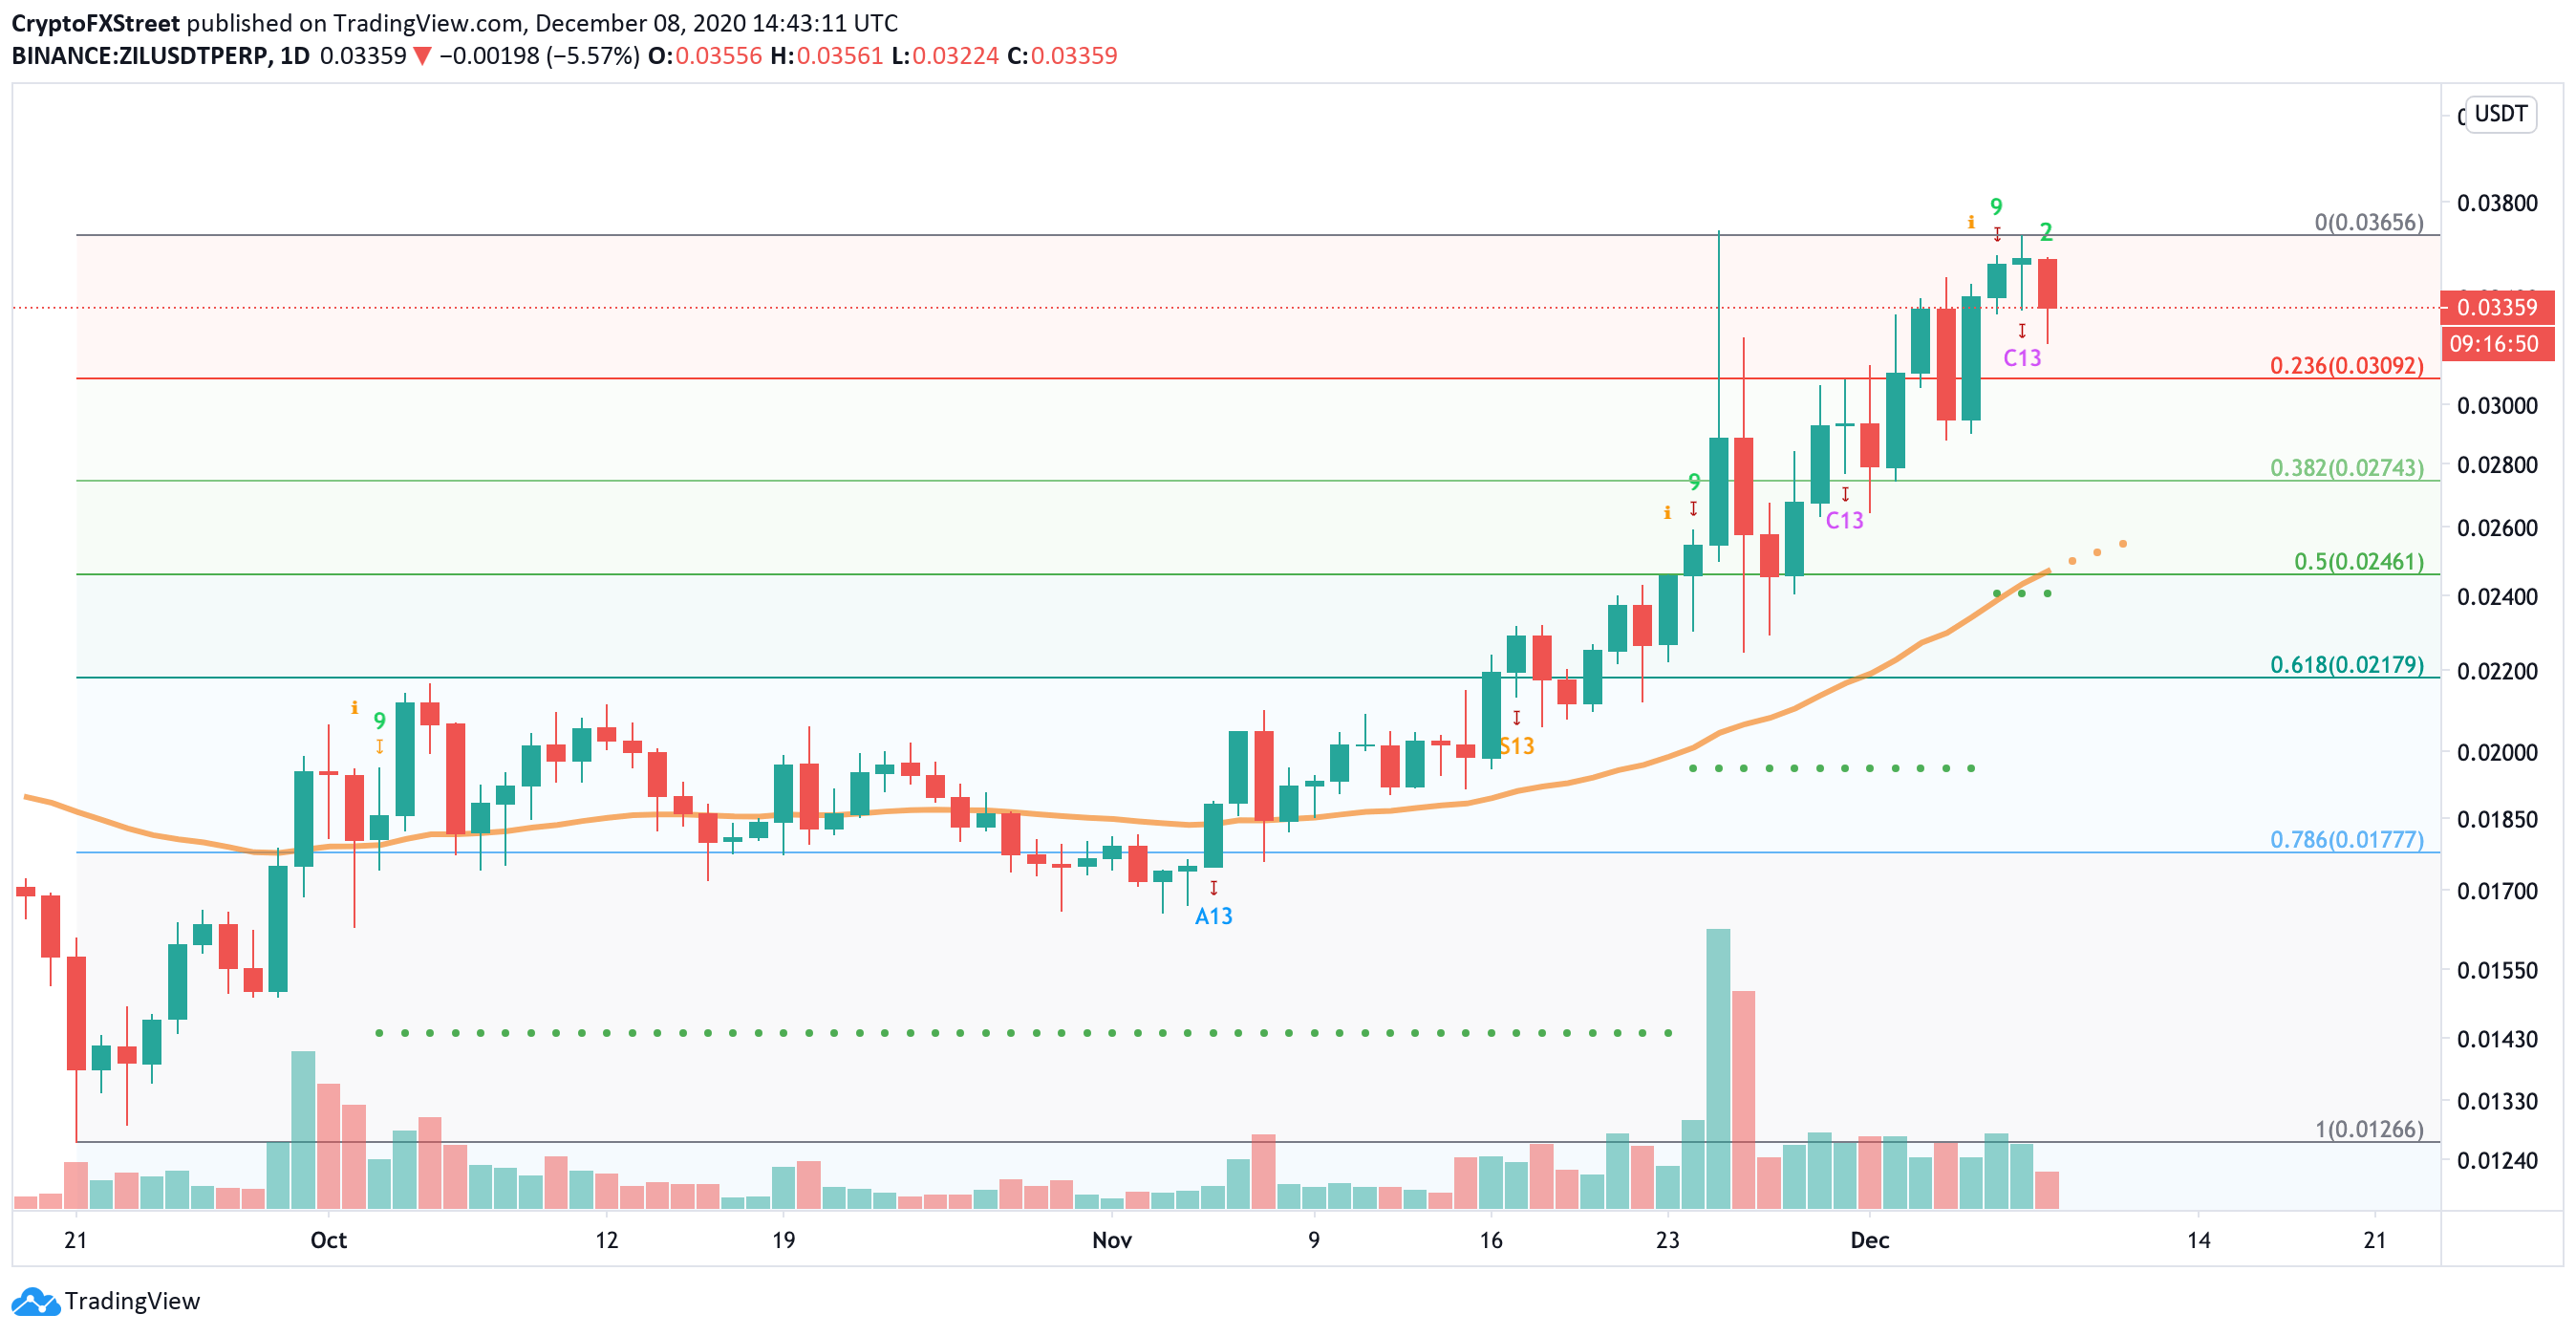
ZIL/USD daily chart
We have recently mentioned the potential of Zilliqa price breaking out of a reverse head and shoulders pattern on the weekly chart, which was confirmed this week. The previous neckline at $0.028 could also be a potential support level if there is more selling pressure.
On the other hand, considering that ZIL did break out of an inverse head and shoulders, which is a heavily bullish pattern, the digital asset can easily continue climbing higher as there isn’t a lot of resistance to the upside, potentially targeting the next psychological level at $0.04.
