- Bitcoin Cash price is currently trading inside an uptrend but could face short-term resistance.
- BCH faces one critical resistance level before $300.
Bitcoin Cash price has been able to establish a 12-hour uptrend and climbed above two critical support levels in the form of moving averages. The digital asset aims to climb above $300, but could be facing a mild correction in the short-term first.
Bitcoin Cash faces a sell signal in the short-term
On the 12-hour chart, the TD Sequential indicator is on the verge of presenting a sell signal despite the digital asset climbing above the 50-SMA and the 100-SMA. Confirmation of the call can push BCH towards the 100-SMA at $285 and as low as $270 where the 50-SMA currently stands.
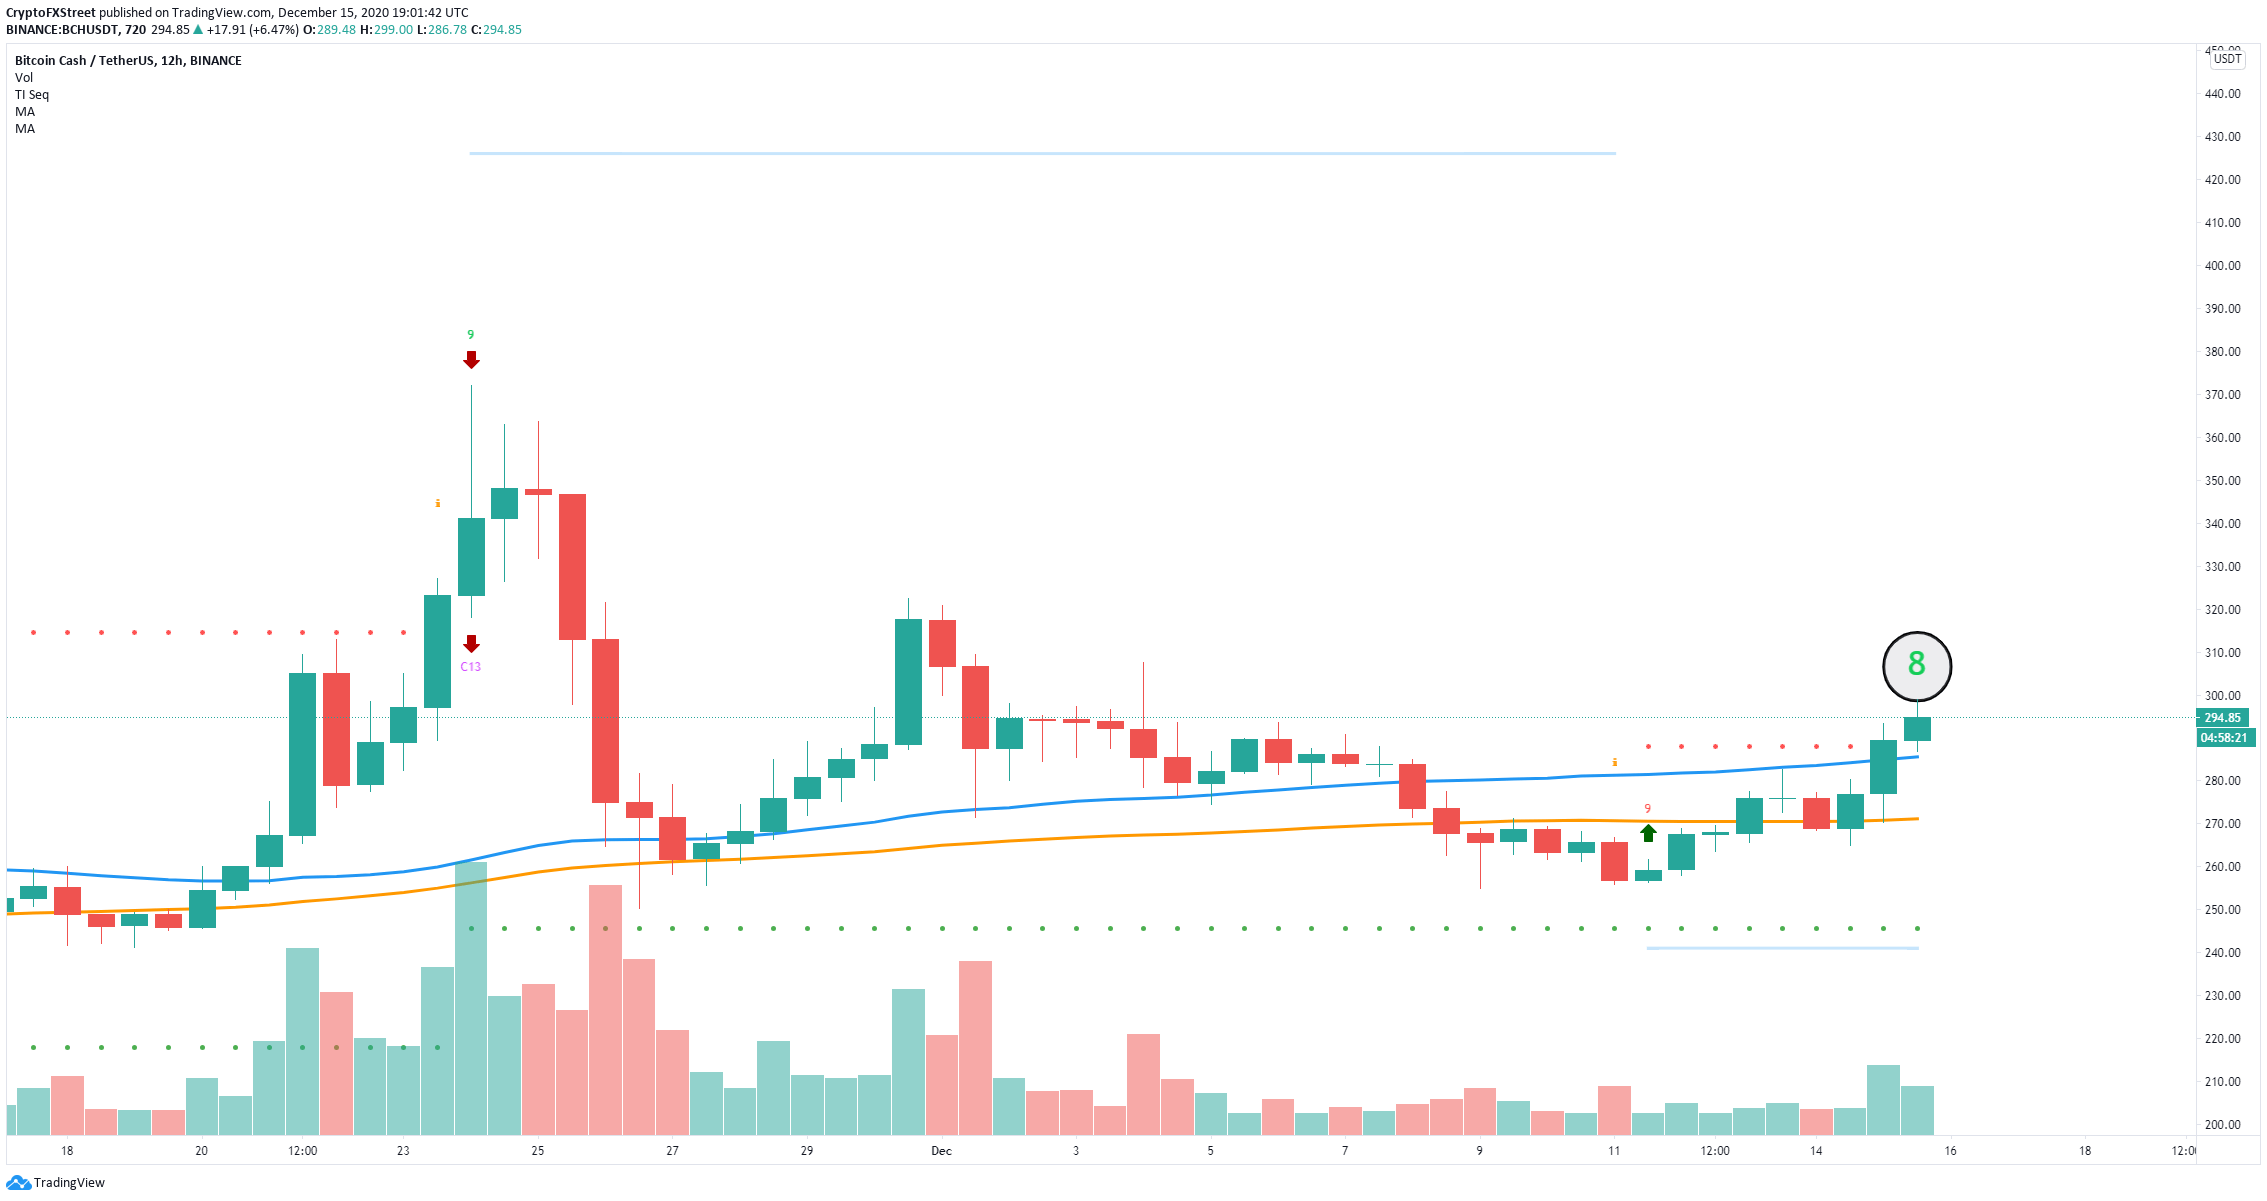
BCH/USD 12-hour chart
According to the confluence detector, the most significant support level is formed at $294 where the previous weekly high and hourly low coincide. Nearby, there is also some support around the $293 level. It seems that a breakdown below these levels would push Bitcoin Cash to the $270 target mentioned above.
On the other hand, bulls face very little resistance towards $300. The most vital level is $298 where the Pivot Point 1 Day R3 is established. It seems that above this point, BCH is free to run towards $320.
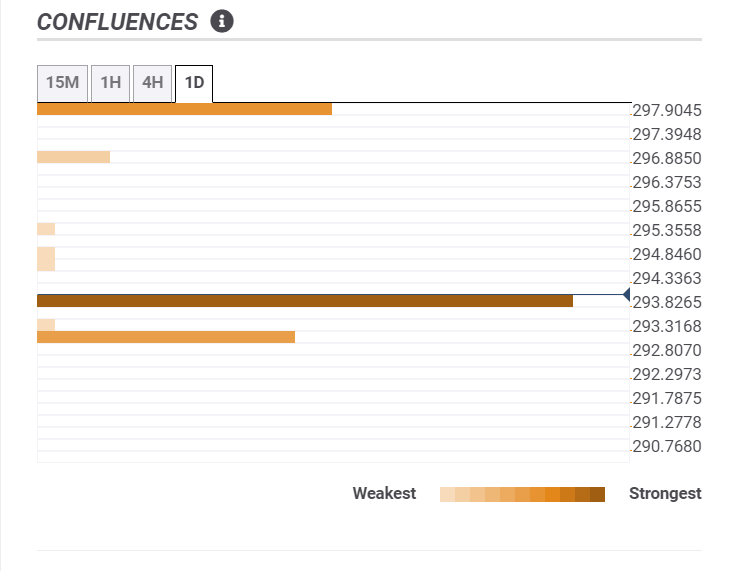
BCH/USD confluence levels
The In/Out of the Money Around Price (IOMAP) seems to show a similar story indicating that there is a lot of support on the way down below $292 but only a crucial resistance area between $302 and $309.
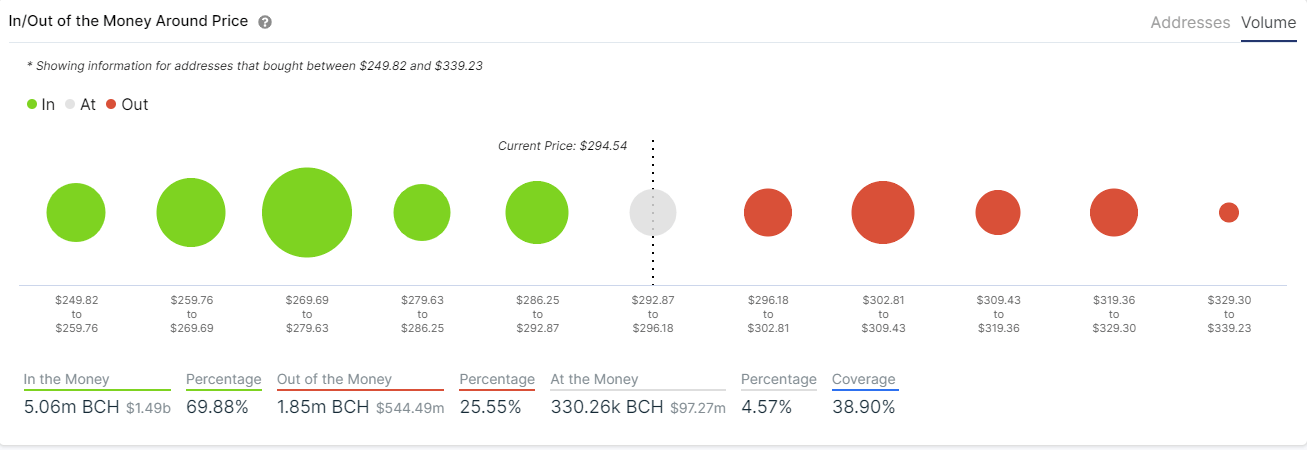
BCH IOMAP chart
The IOMAP adds credence to the bullish theory that a breakout above $300 would lead BCH towards $320 and above. Similarly, the most critical support level is the bearish price target of $270.
