- Yearn.Finance price has formed a bullish divergence with the RSI on the 12-hour chart.
- The digital asset seems poised for a massive breakout towards $32,000 after holding a crucial support level.
YFI established a strong uptrend support trendline on the 12-hour chart and has defended it again in the past 24 hours right after Bitcoin cracked $20,000 for the first time ever. YFI currently trades at $27,199.
Yearn.Finance price stays above critical support level
On the 12-hour chart, YFI price has established a bullish divergence with the RSI, forming higher lows while the technical indicator has formed lower lows. This is a long-term divergence that started around the beginning of November.
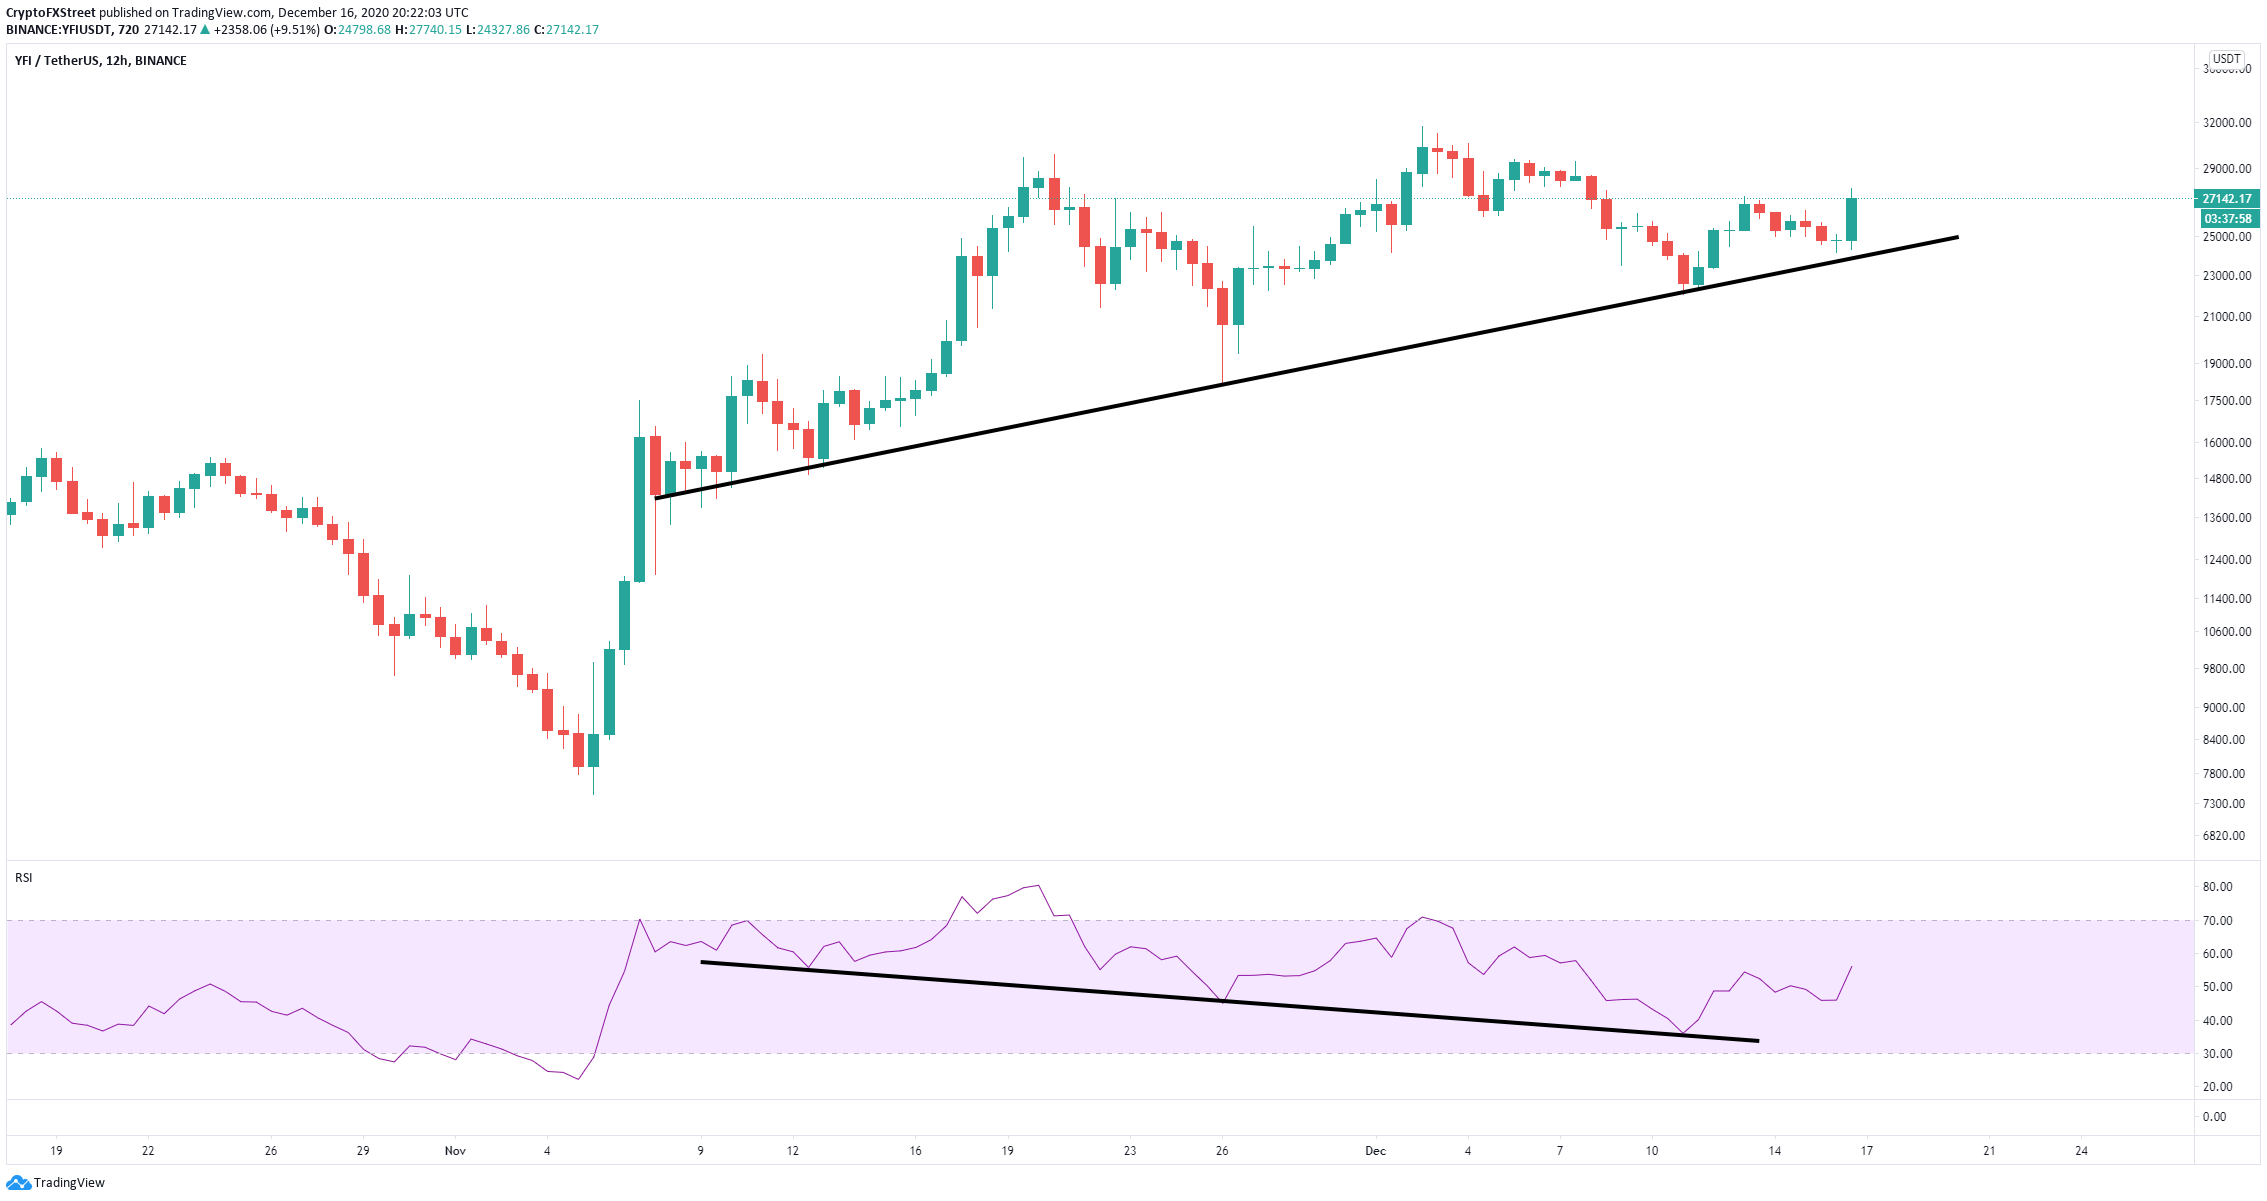
YFI/USD 12-hour chart
Additionally, YFI bulls defended the support trendline at $24,200 and the price is currently rebounding aiming for a potential price target of $32,000.
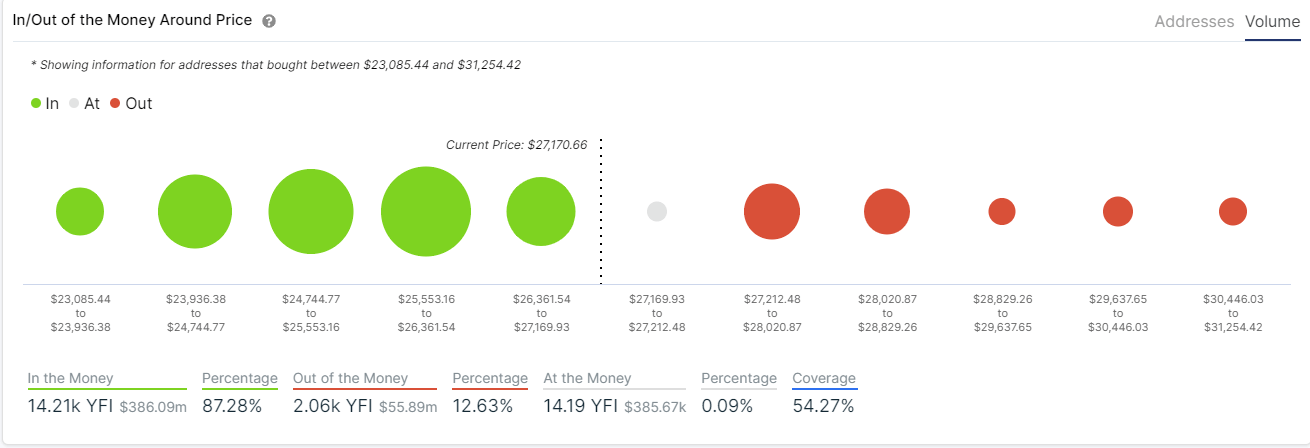
YFI IOMAP chart
Additionally, the In/Out of the Money Around Price (IOMAP) chart shows very little resistance to the upside. The most significant resistance area seems to be located between $27,212 and $28,000.
A breakout above this range can quickly push Yearn.Finance price to the target of $32,000. On the other hand, the IOMAP chart indicates there is steep support on the way down starting at $27,169.
