- Cardano price remains contained inside an ascending triangle pattern on the 12-hour chart.
- An important indicator is on the verge of presenting a buy signal for Cardano.
Cardano has lost the 12-hour chart uptrend and it’s struggling to defend a critical support level at $0.144. Although bears are in control of the short-term, bulls still have a chance to comeback if they can hold.
Cardano price must defend $0.144 to survive
Cardano is currently trading at $0.147 after a small bounce from the significant support level at $0.144, which is the lower trendline of the ascending triangle on the 12-hour chart. This is a critical point that must be defended.
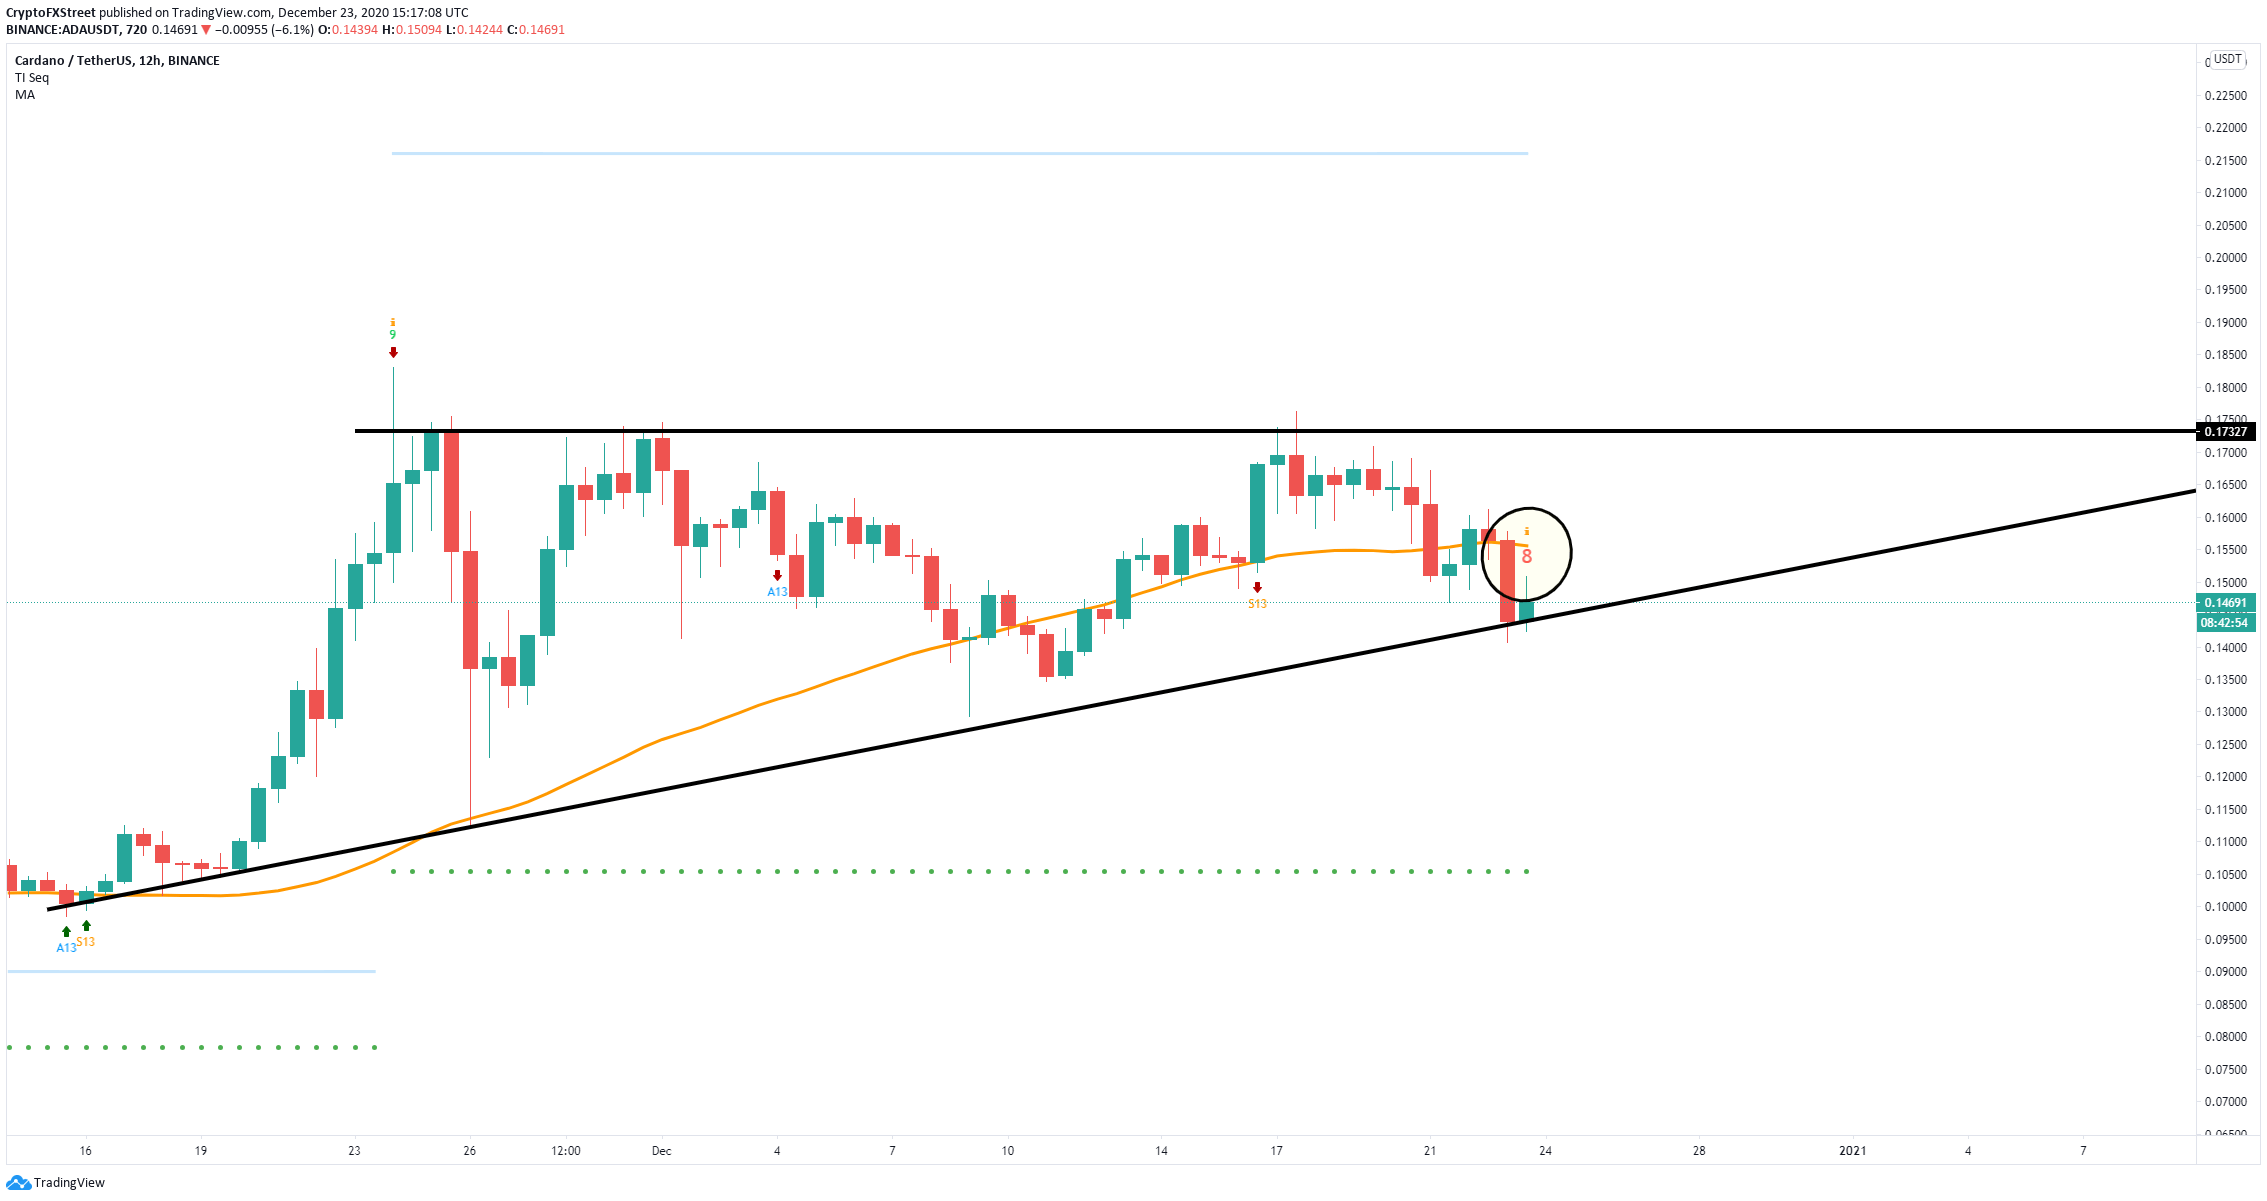
ADA/USD 12-hour chart
The 50-SMA resistance level at $0.155 is the next hurdle for the bulls. A breakout above that point, turning the moving average into support, will most likely push Cardano price towards the upper boundary of the pattern at $0.173. Additionally, the TD Sequential indicator has formed a red ‘8’ candle which is usually followed by a buy signal, giving even more credence to the bullish outlook.
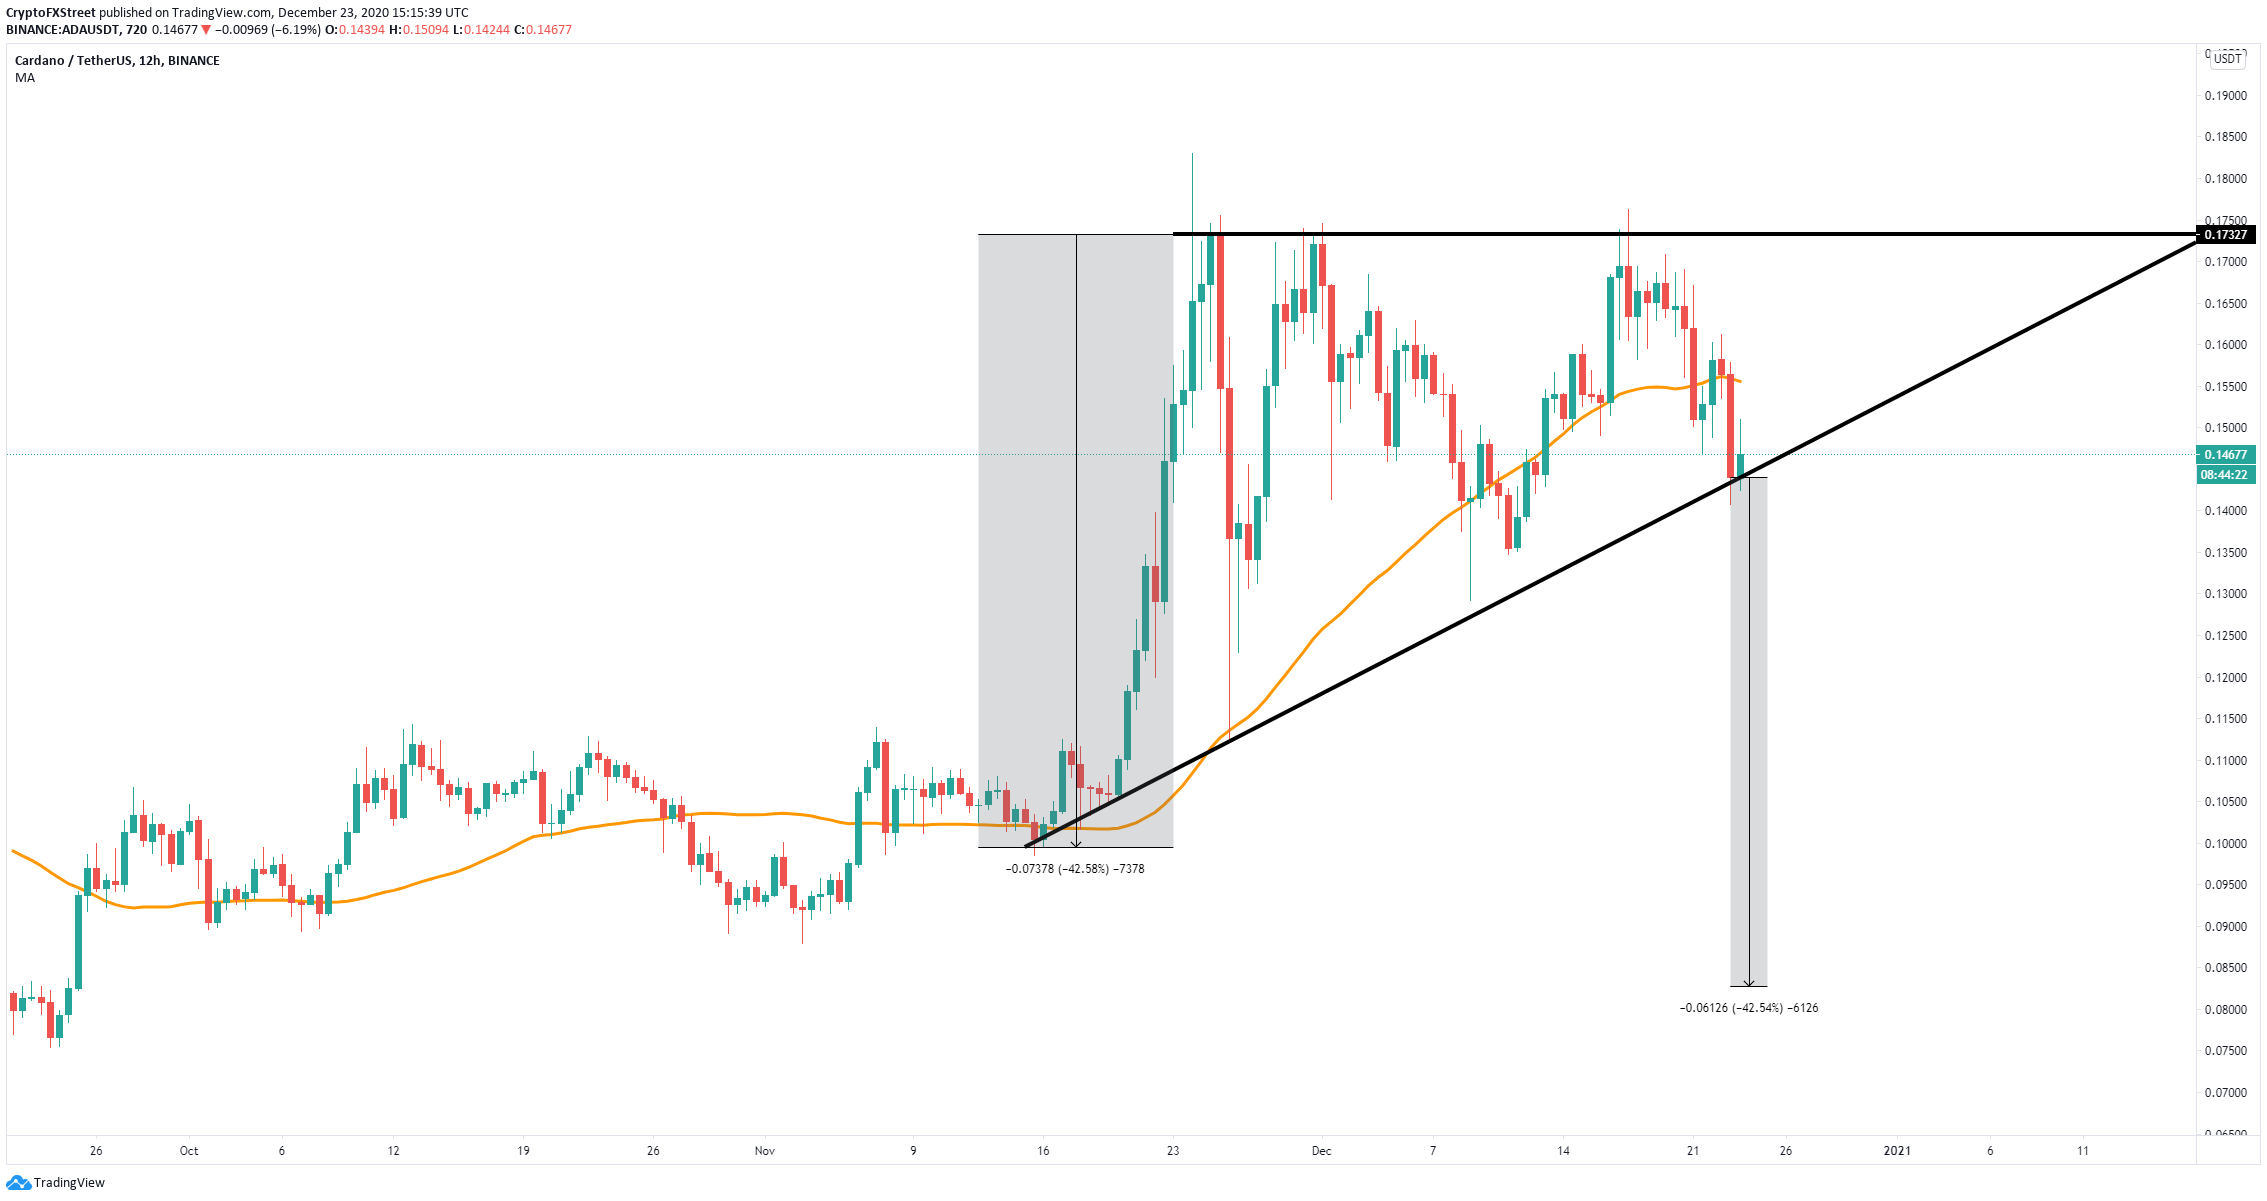
ADA/USD 12-hour chart
However, if bulls cannot defend the $0.144 support level, bears will remain in control targeting a long-term price of $0.082.
