- Dash price remains contained inside a symmetrical triangle pattern on the 12-hour chart.
- Several indicators suggest the digital asset is poised for a major move within the next few hours.
Dash price continues trading sideways but seems to be on the verge of a breakout as the range tightens. The digital asset faces one last critical resistance level before a massive 50% breakout which could push Dash towards $160.
Dash price is at a do-or-die scenario
On the 12-hour chart, Dash has established a symmetrical triangle pattern and is currently trading above the 50-SMA and the 100-SMA. The most critical resistance level is the upper trendline of the pattern at $107.
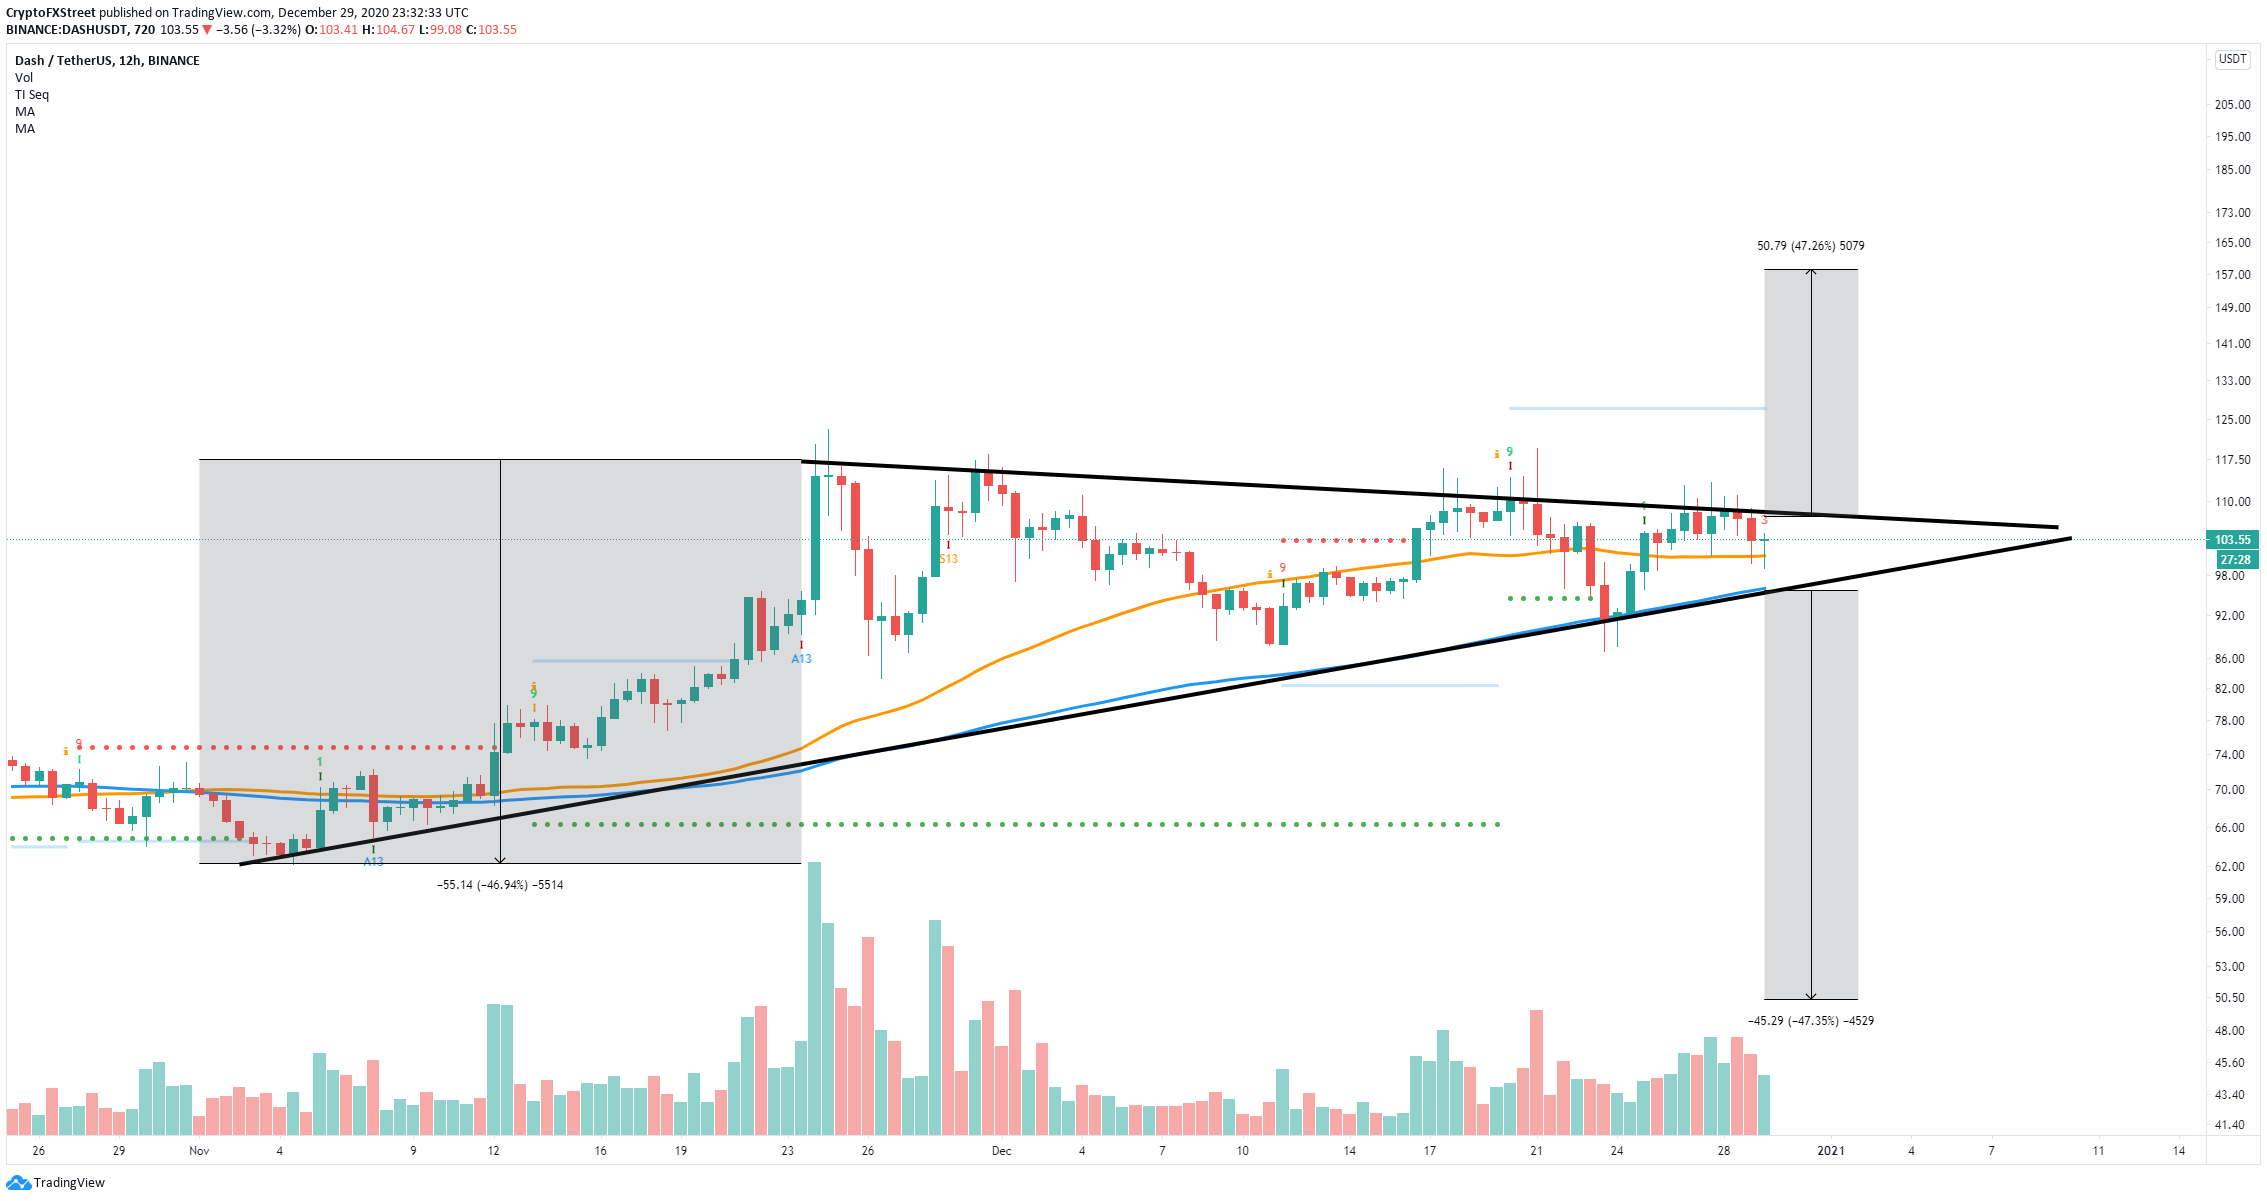
DASH/USD 12-hour chart
A breakout above this crucial resistance level would quickly push Dash price towards a high of $160, which is a 47% breakout. This seems to be the most likely scenario as the TD Sequential indicator has just presented a buy signal on the 4-hour chart. Additionally, the Bollinger Bands have squeezed significantly, which indicates a major move is underway.

DASH/USD 4-hour chart
However, bears can still push Dash towards the lower trendline of the pattern at $98. A breakdown below this point would also push Dash price by 47% down to $50 in the long-term.
