- Chainlink price has formed another daily ascending parallel channel.
- A breakout above the crucial resistance level at $18 can quickly push LINK towards $25.
- The digital asset could face a short-term pullback before a breakout.
Chainlink had a massive drop on December 23, 2020, from a high of $12.86 to a low of $8. However, bulls managed to buy the dip and pushed LINK towards $13.24 within the next week. The current price of the digital asset is $16.3.
Chainlink price could hit $25 but might face a short-term correction
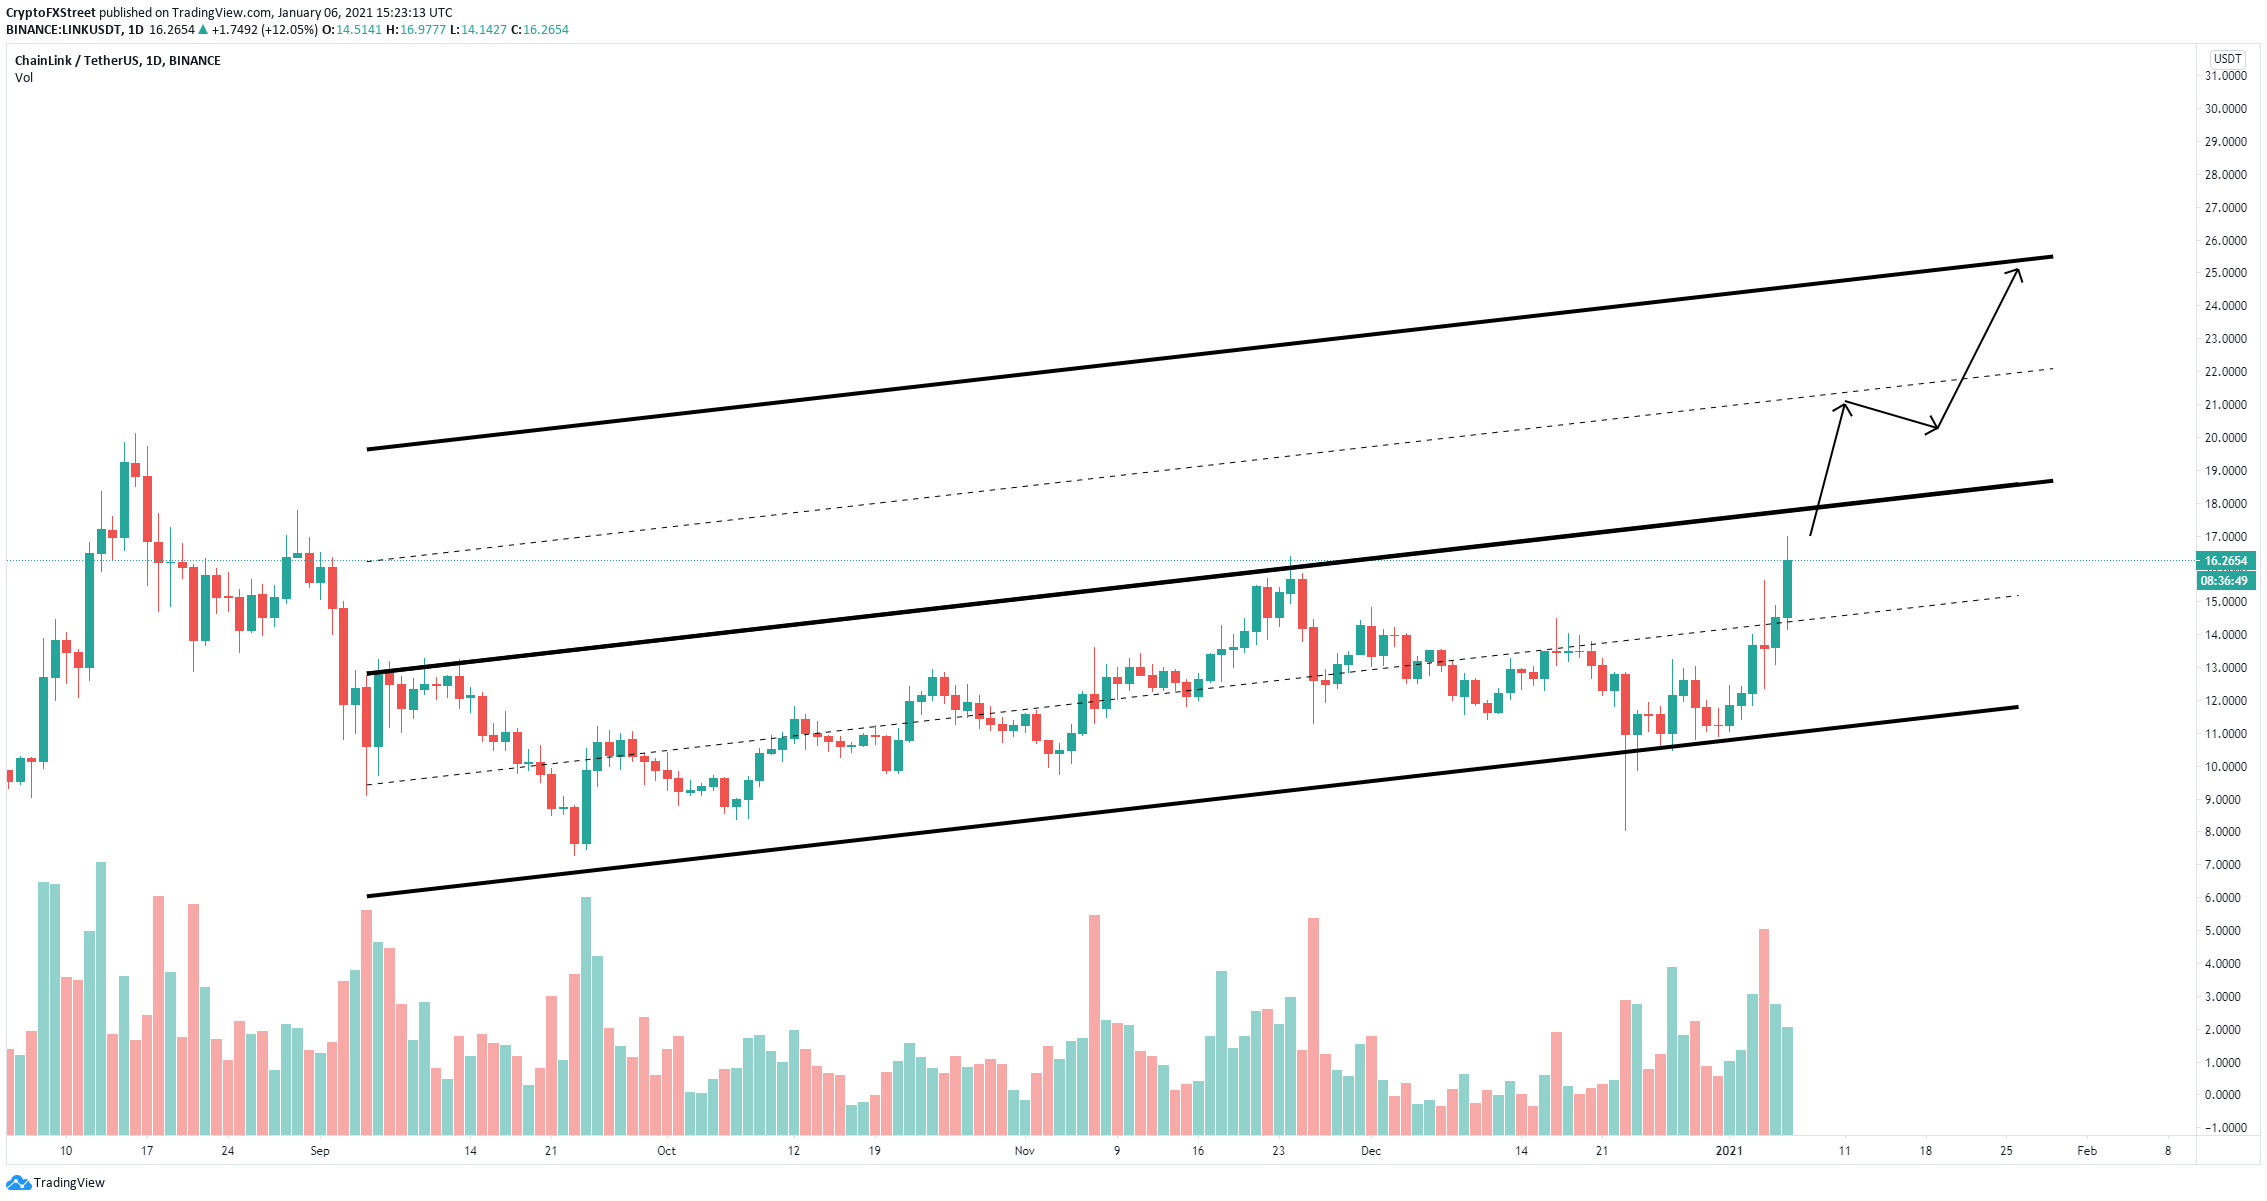
Chainlink price is up 110% since the dip to $8 on December 23. LINK has established a new ascending parallel channel on the daily chart and it’s close to the upper trendline resistance level at $18.
LINK/USD daily chart
LINK has established and confirmed a daily uptrend and aims to crack the resistance point at $18. A breakout above this level can quickly drive Chainlink price towards $22 and eventually to the $25 price target.
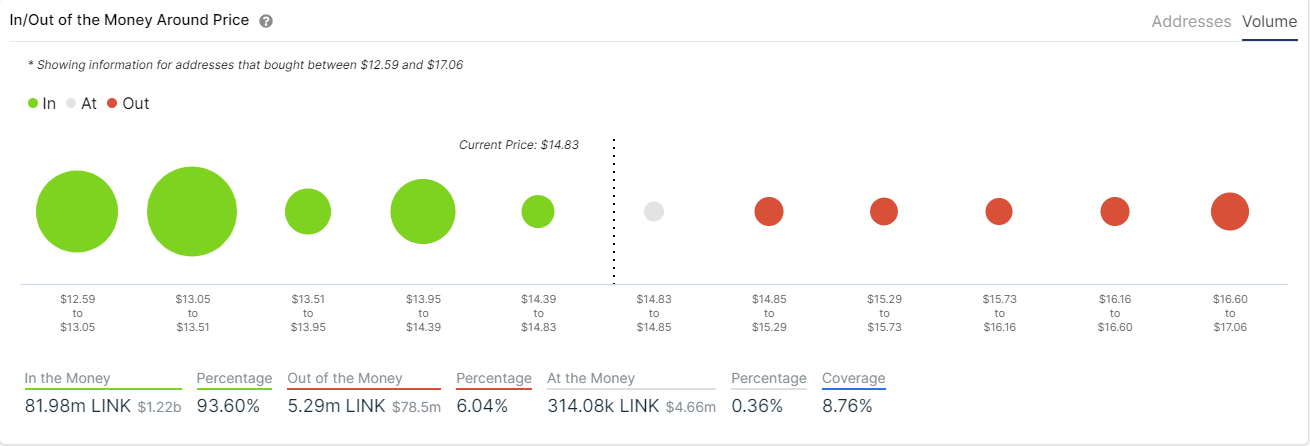
LINK IOMAP chart
The In/Out of the Money Around Price (IOMAP) chart shows practically no resistance ahead in comparison to the support below, adding credence to the bullish outlook.
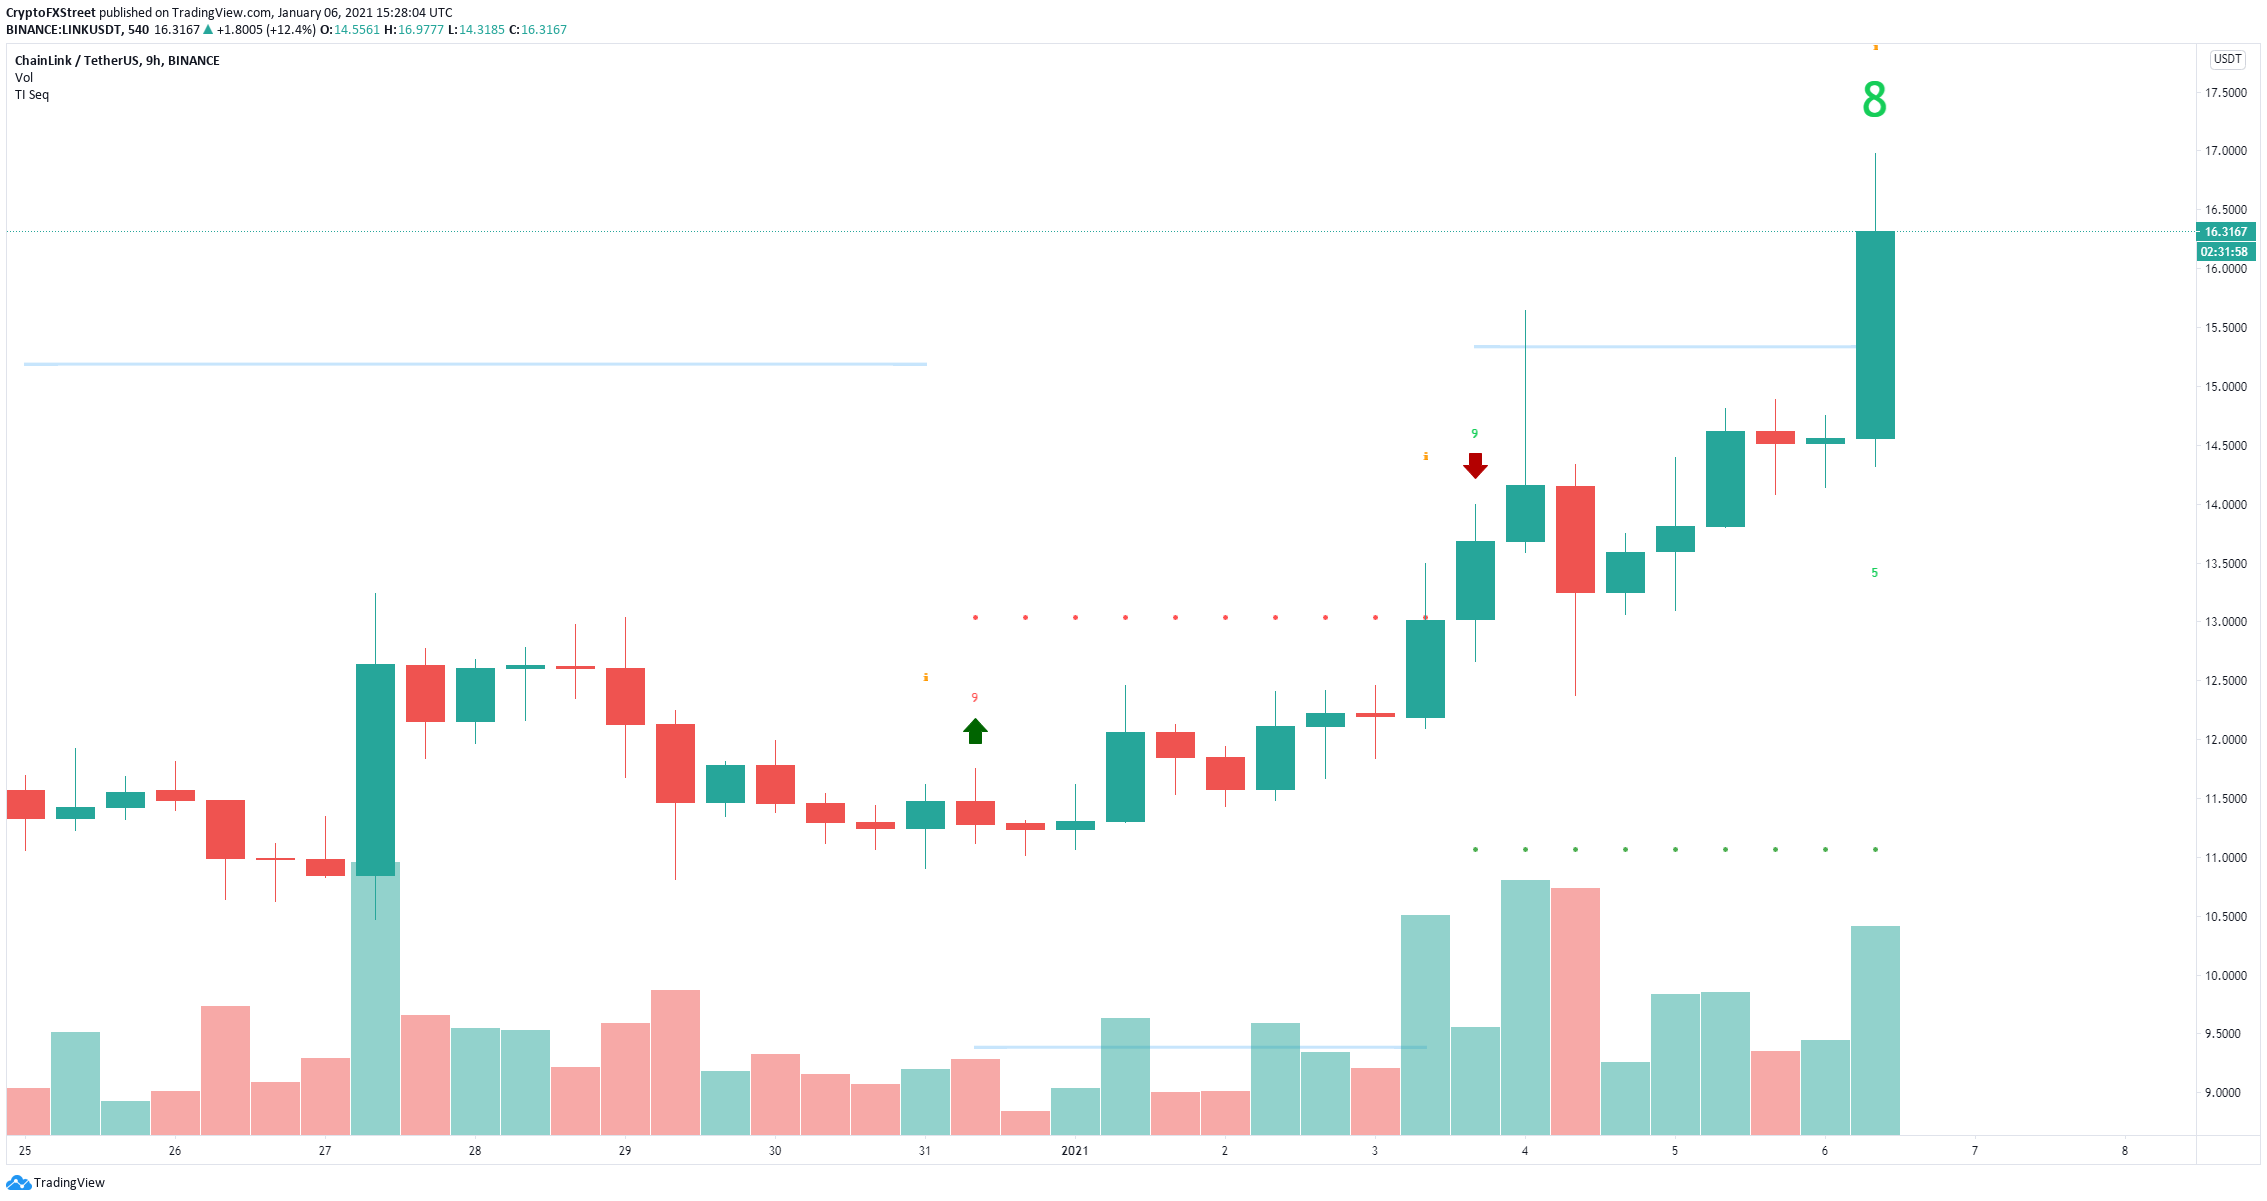
LINK/USD 9-hour chart
However, the TD Sequential indicator has just presented a green ‘8’ candle on the 9-hour chart, which should be followed by a sell signal. Confirmation of the call could push Chainlink price towards $13.27, which is a strong support level according to the IOMAP chart.


