- Zilliqa price has seen a breakout from a descending parallel channel on the 1-hour chart.
- The bullish price target stands at $0.10 but the digital asset might face short-term resistance.
Zilliqa was trading inside a long descending parallel channel on the 1-hour chart before finally breaking out above the critical resistance level at $0.78. The digital asset peaked at $0.085 before a slight rejection.
Zilliqa price aims for $0.10 but might need to see a pullback first
Zilliqa was facing a robust resistance level at $0.08 which was the upper trendline of the parallel channel and finally managed to climb above it hitting $0.085 within five hours of the breakout.
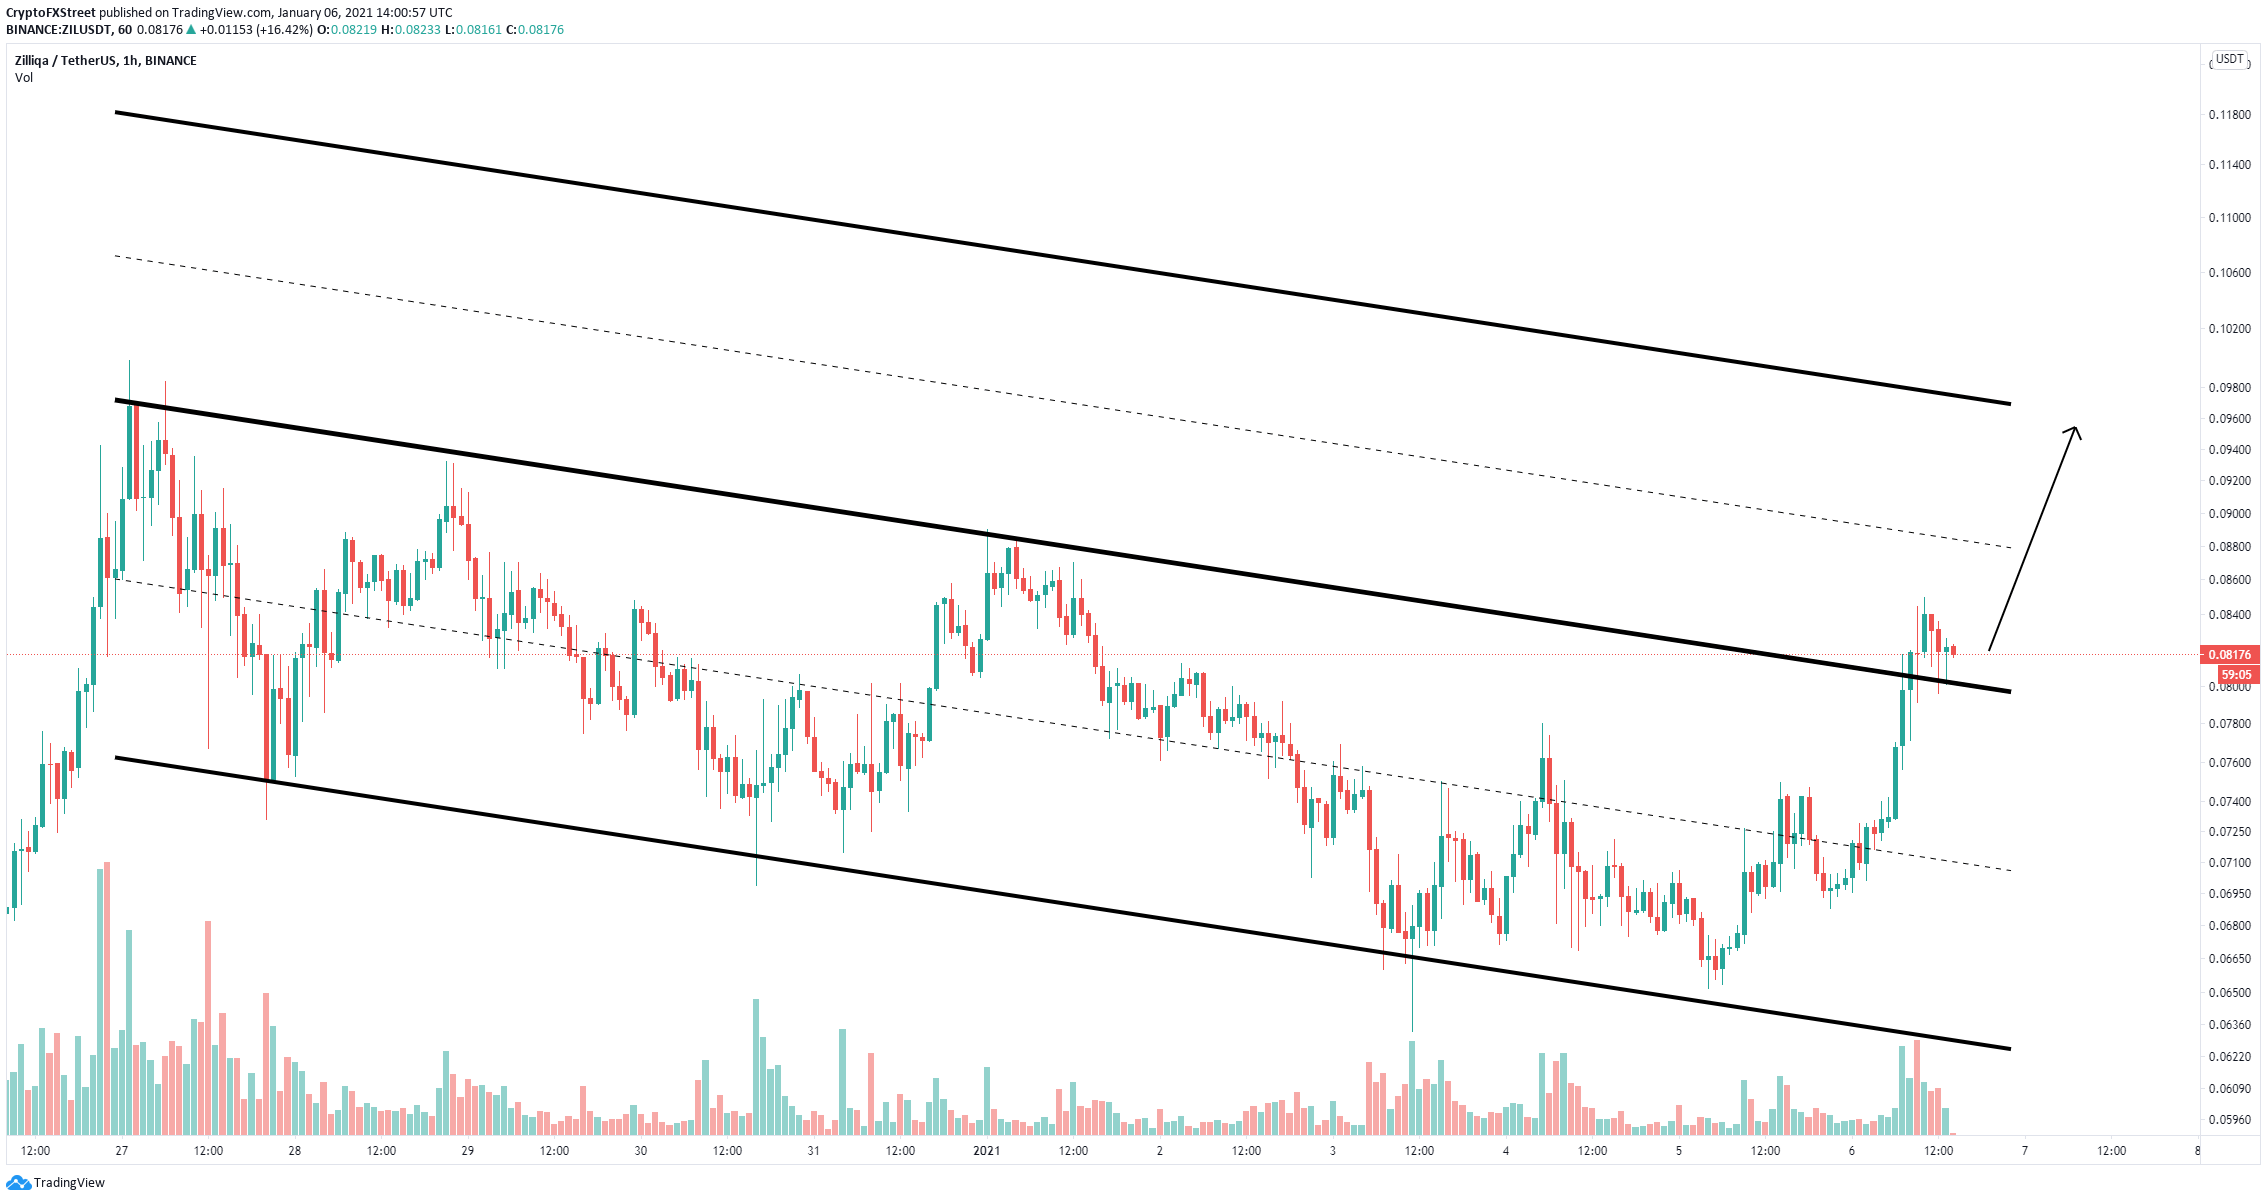
ZIL/USD 1-hour chart
The digital asset has an initial price target of $0.088 and eventually $0.10, which can be calculated using the height of the previous parallel channel. However, it’s important to note that Zilliqa has shown signs of a potential short-term correction.
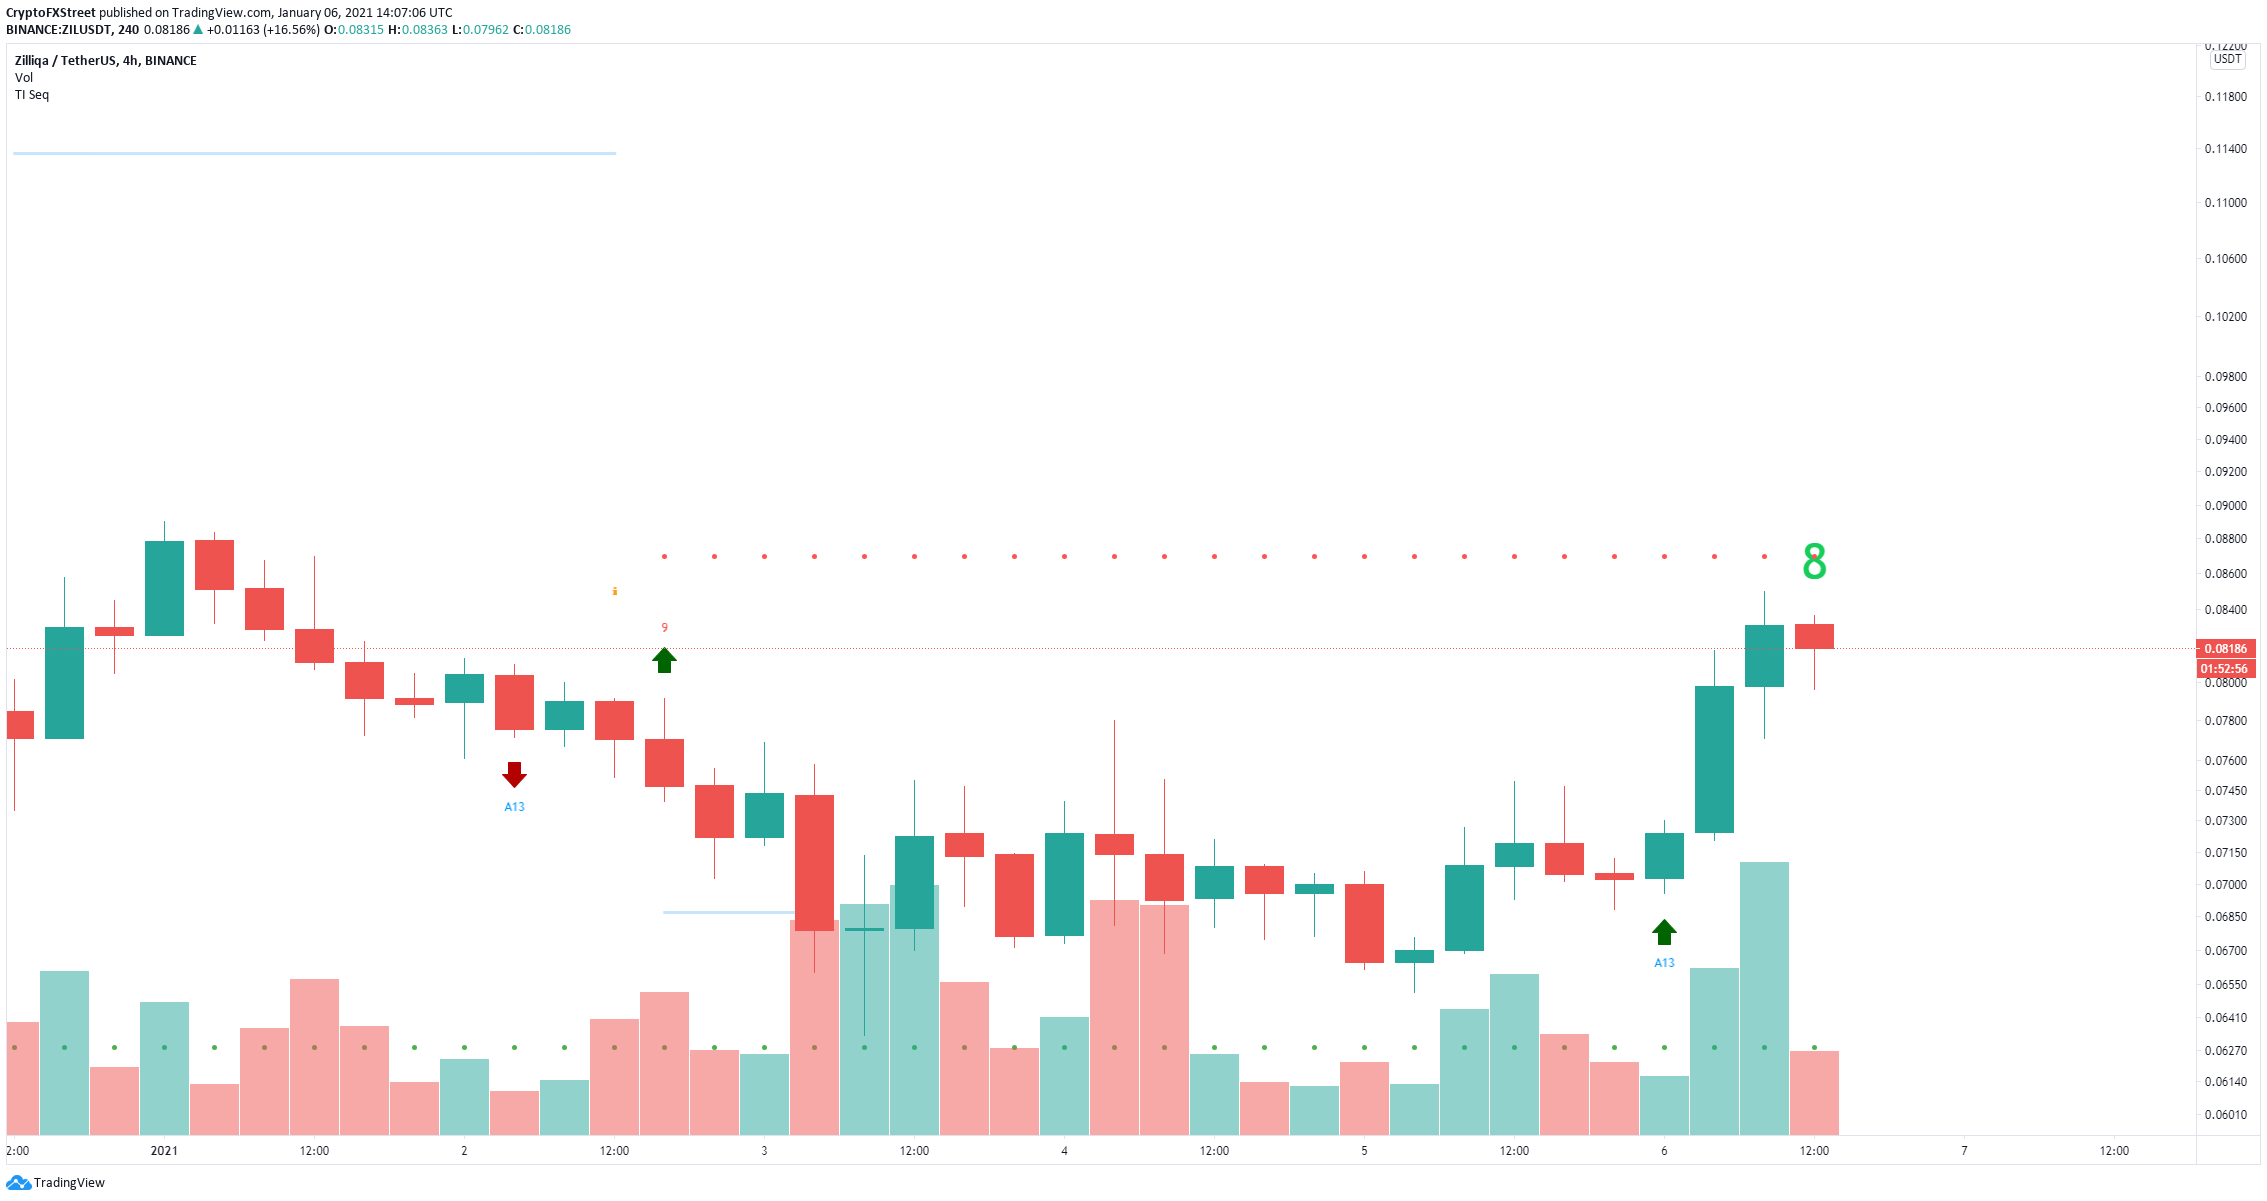
ZIL/USD 4-hour chart
On the 4-hour chart, the TD Sequential indicator seems to be on the verge of presenting a sell signal after posting a green ‘8’ candle. Confirmation of this call could quickly push Zilliqa price to the previous trendline of the parallel channel at $0.08. A breakdown below this point would greatly shift the odds in favor of the bears targeting $0.07.
