- Chainlink price suffered a significant 32% correction on January 10.
- The digital asset needs to regain a crucial resistance level at $15.47 to resume the uptrend.
Chainlink hit a high of $17.39 on January 7 and saw a breakout on January 9 above this level climbing towards $18.43. Unfortunately, Bitcoin crashed hard and took the entire market with it. LINK plummeted down to $12.5 and bulls fight to regain control.
Chainlink price must conquer $15.5 to climb higher
On the 4-hour chart, Chainlink established a downtrend but bulls have defended a crucial support level in the form of the 100-SMA. LINK set a high at $15.47 and a potential higher low at $13.73 compared to the low of the crash at $12.5.
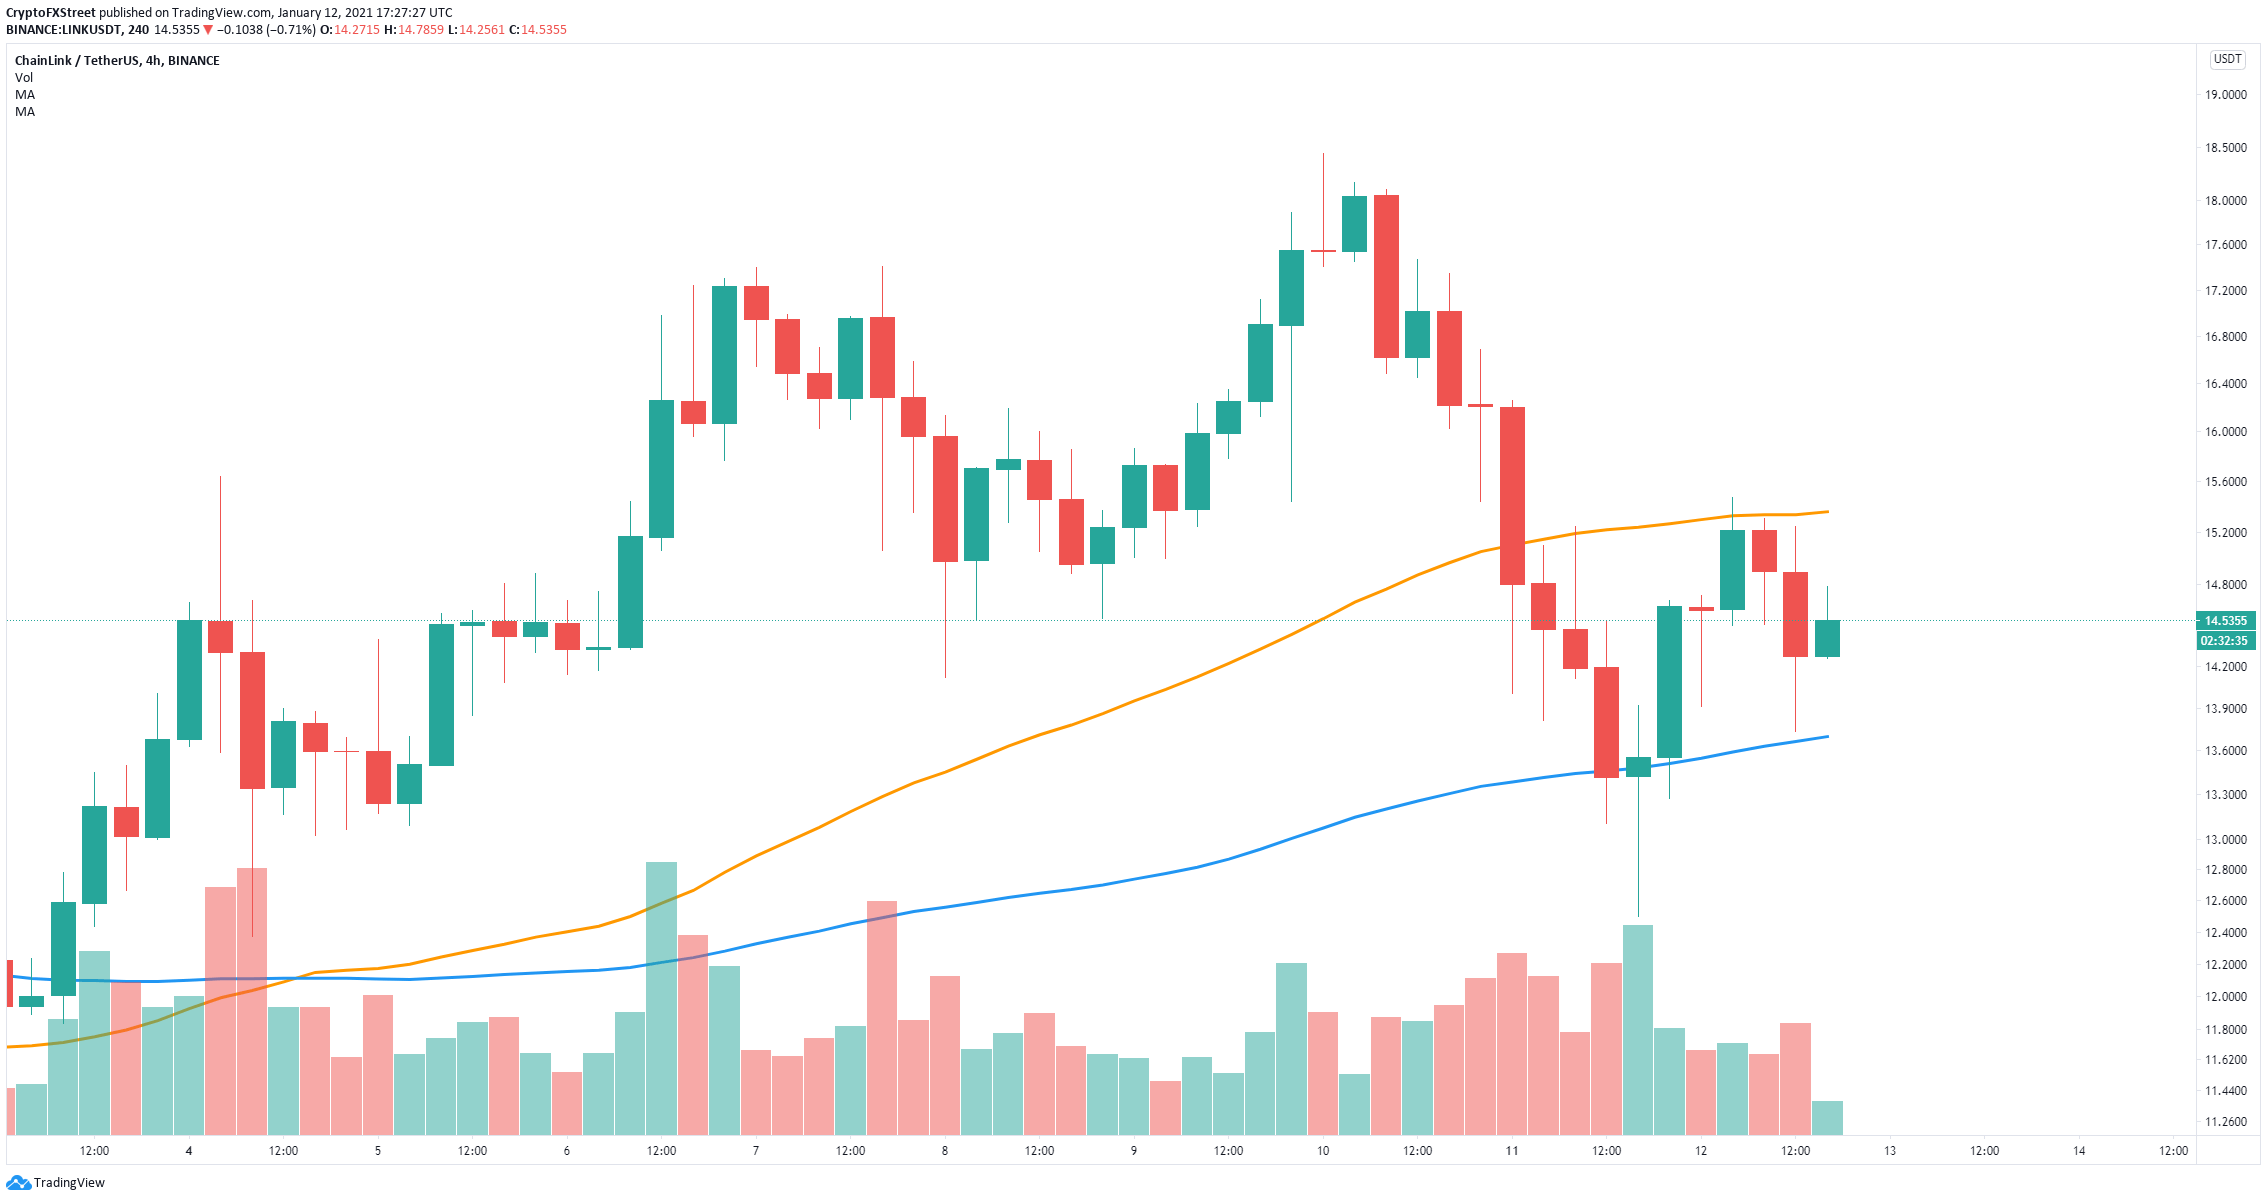
LINK/USD 4-hour chart
In order to confirm an uptrend, Chainlink bulls have to push the digital asset above $15.47 to establish a higher high. This level also coincides with the 50-SMA, which adds credence to the bullish outlook. Above this point, there is very little resistance until $18.
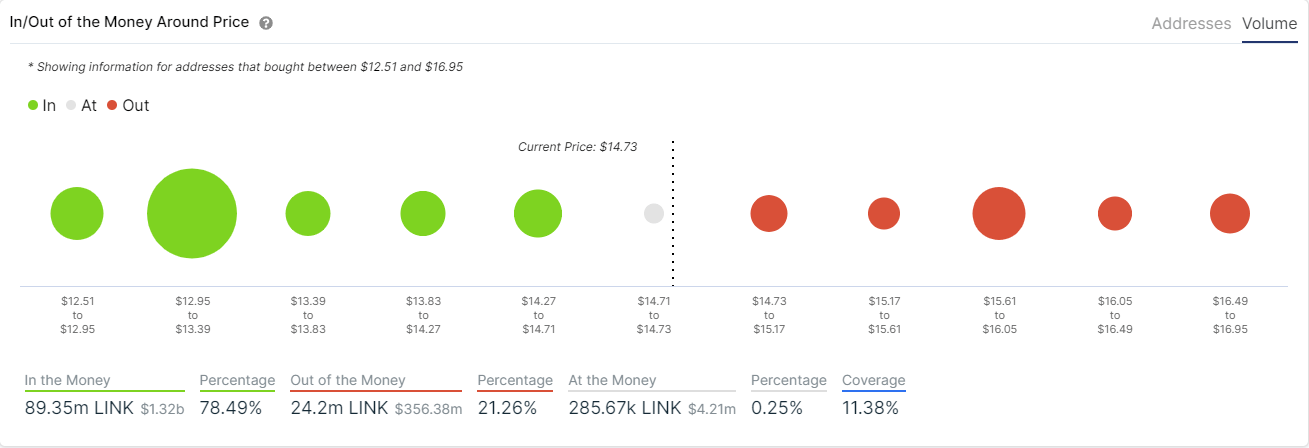
LINK IOMAP chart
The In/Out of the Money Around Price (IOMAP) chart shows a strong resistance level at around $15.7, which coincides with the outlook above. The model indicates that a breakout above this point can quickly drive Chainlink price up as there is very little resistance towards $18.
On the other hand, the same IOMAP chart indicates there is not a lot of support on the way down until the area located between $12.95 and $13.39. A breakdown below this range can drive Chainlink price towards $12.
