- XLM price had a breakout above a parallel channel formed on the 1-hour chart.
- The digital asset initially had a lot of bullish continuation but has dropped significantly.
- If the bulls can’t hold the previous resistance level, XLM price will quickly fall towards $0.45.
XLM price has been trading sideways for the past 24 hours and had a notable breakout in the past hour from $0.47 to $0.48. However, the digital asset slowed down and quickly dropped towards the previous resistance level.
XLM price can climb towards $0.50 if this level is defended
On the 1-hour chart, XLM price had a breakout from a parallel channel. However, it didn’t last long as Stellar dropped from $0.48 to $0.467. If the bulls can defend the previous resistance level at $0.47, they will aim for a target of $0.50.
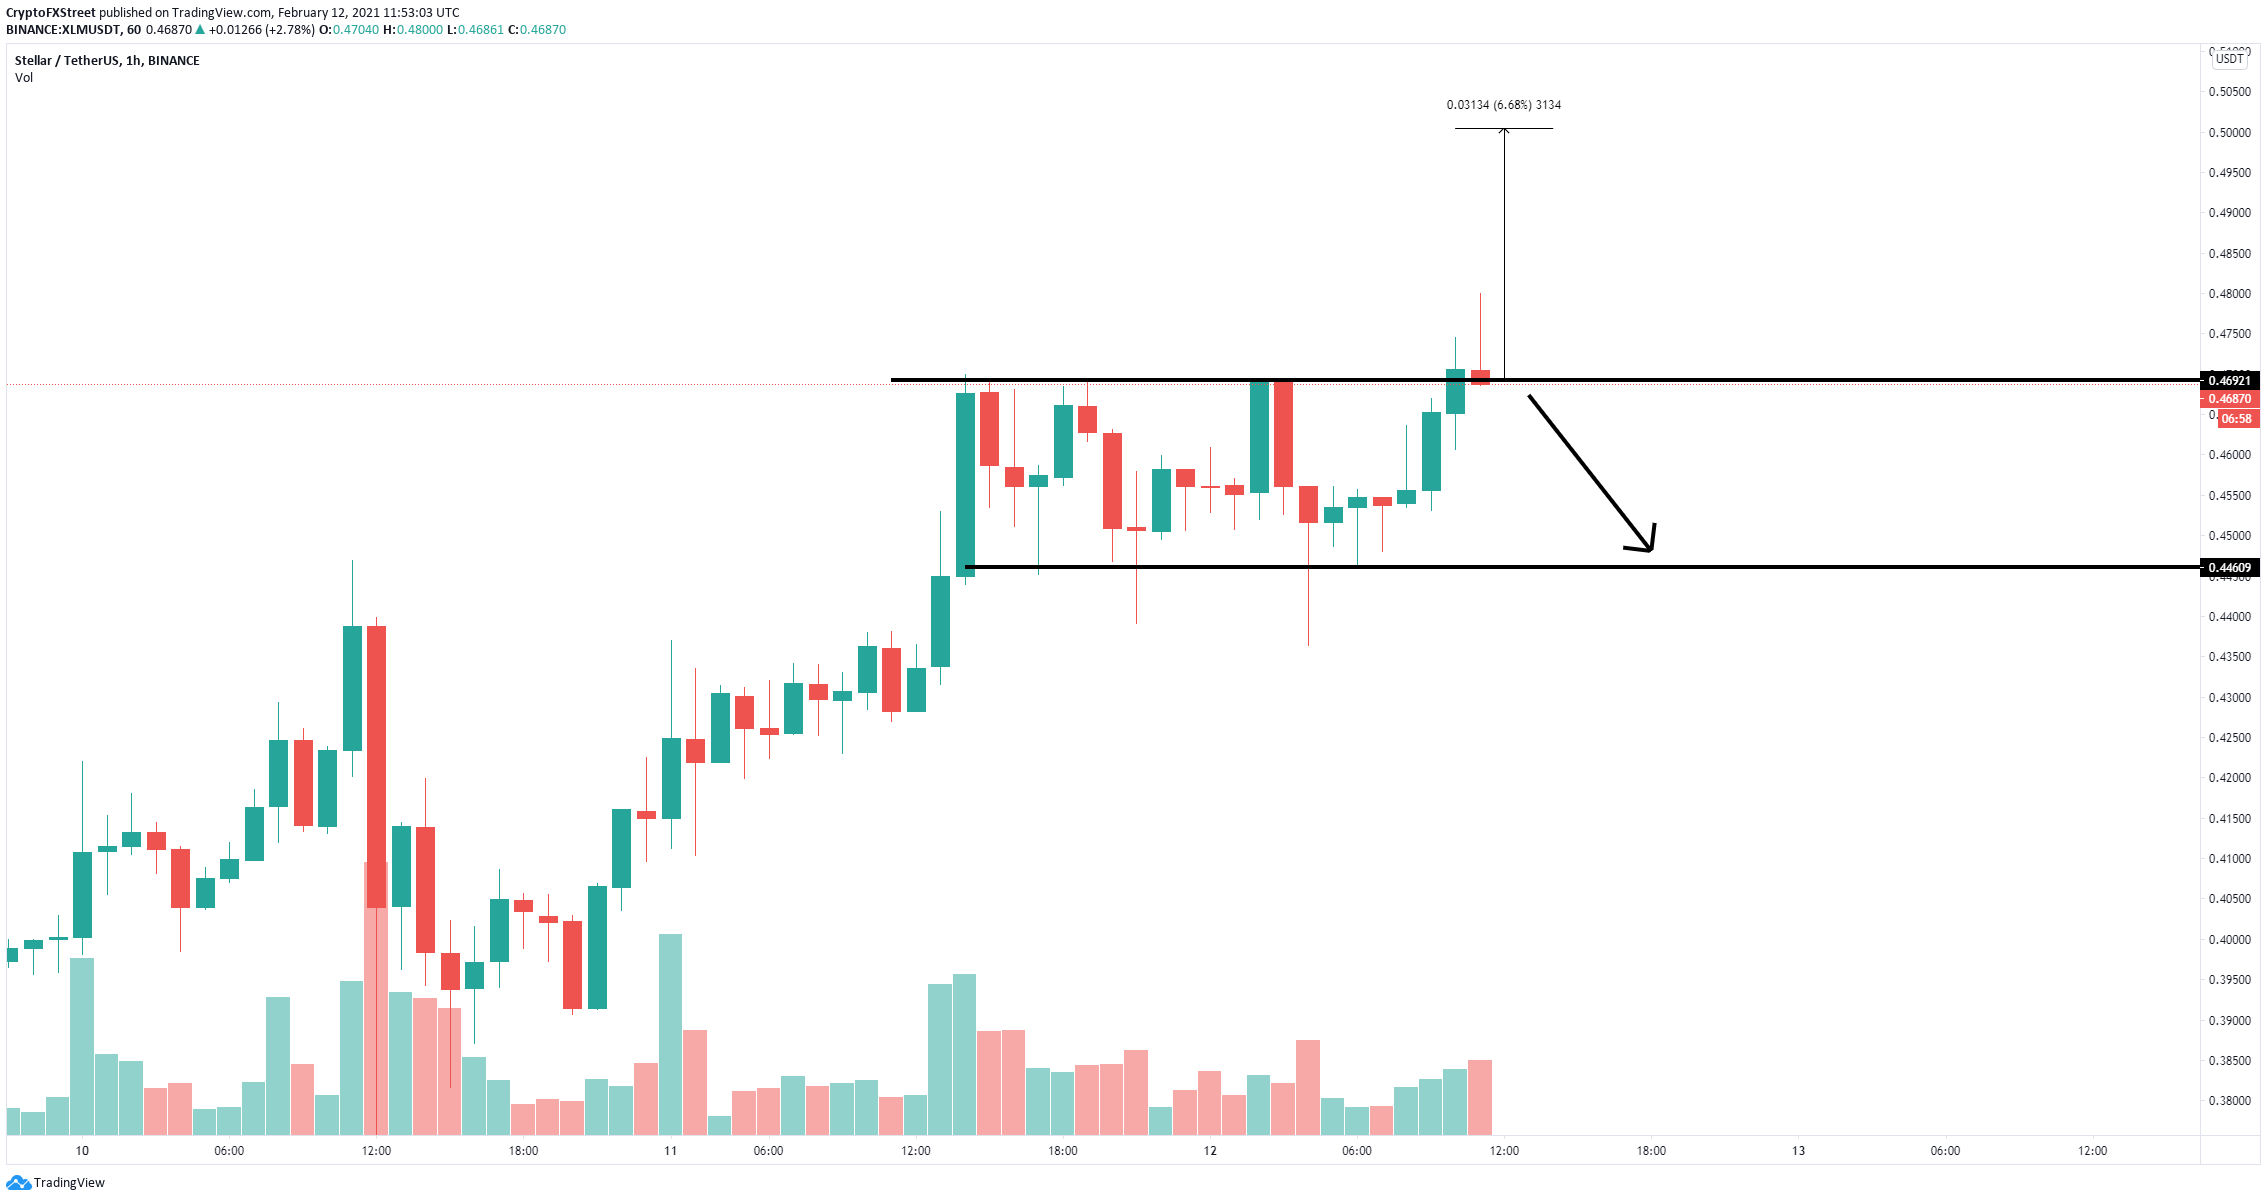
XLM/USD 1-hour chart
XLM bulls seek a long-term price target of $0.70 as the digital asset had a clear breakout from an ascending triangle pattern on the 12-hour chart. The 70% target was calculated using the height of the pattern.
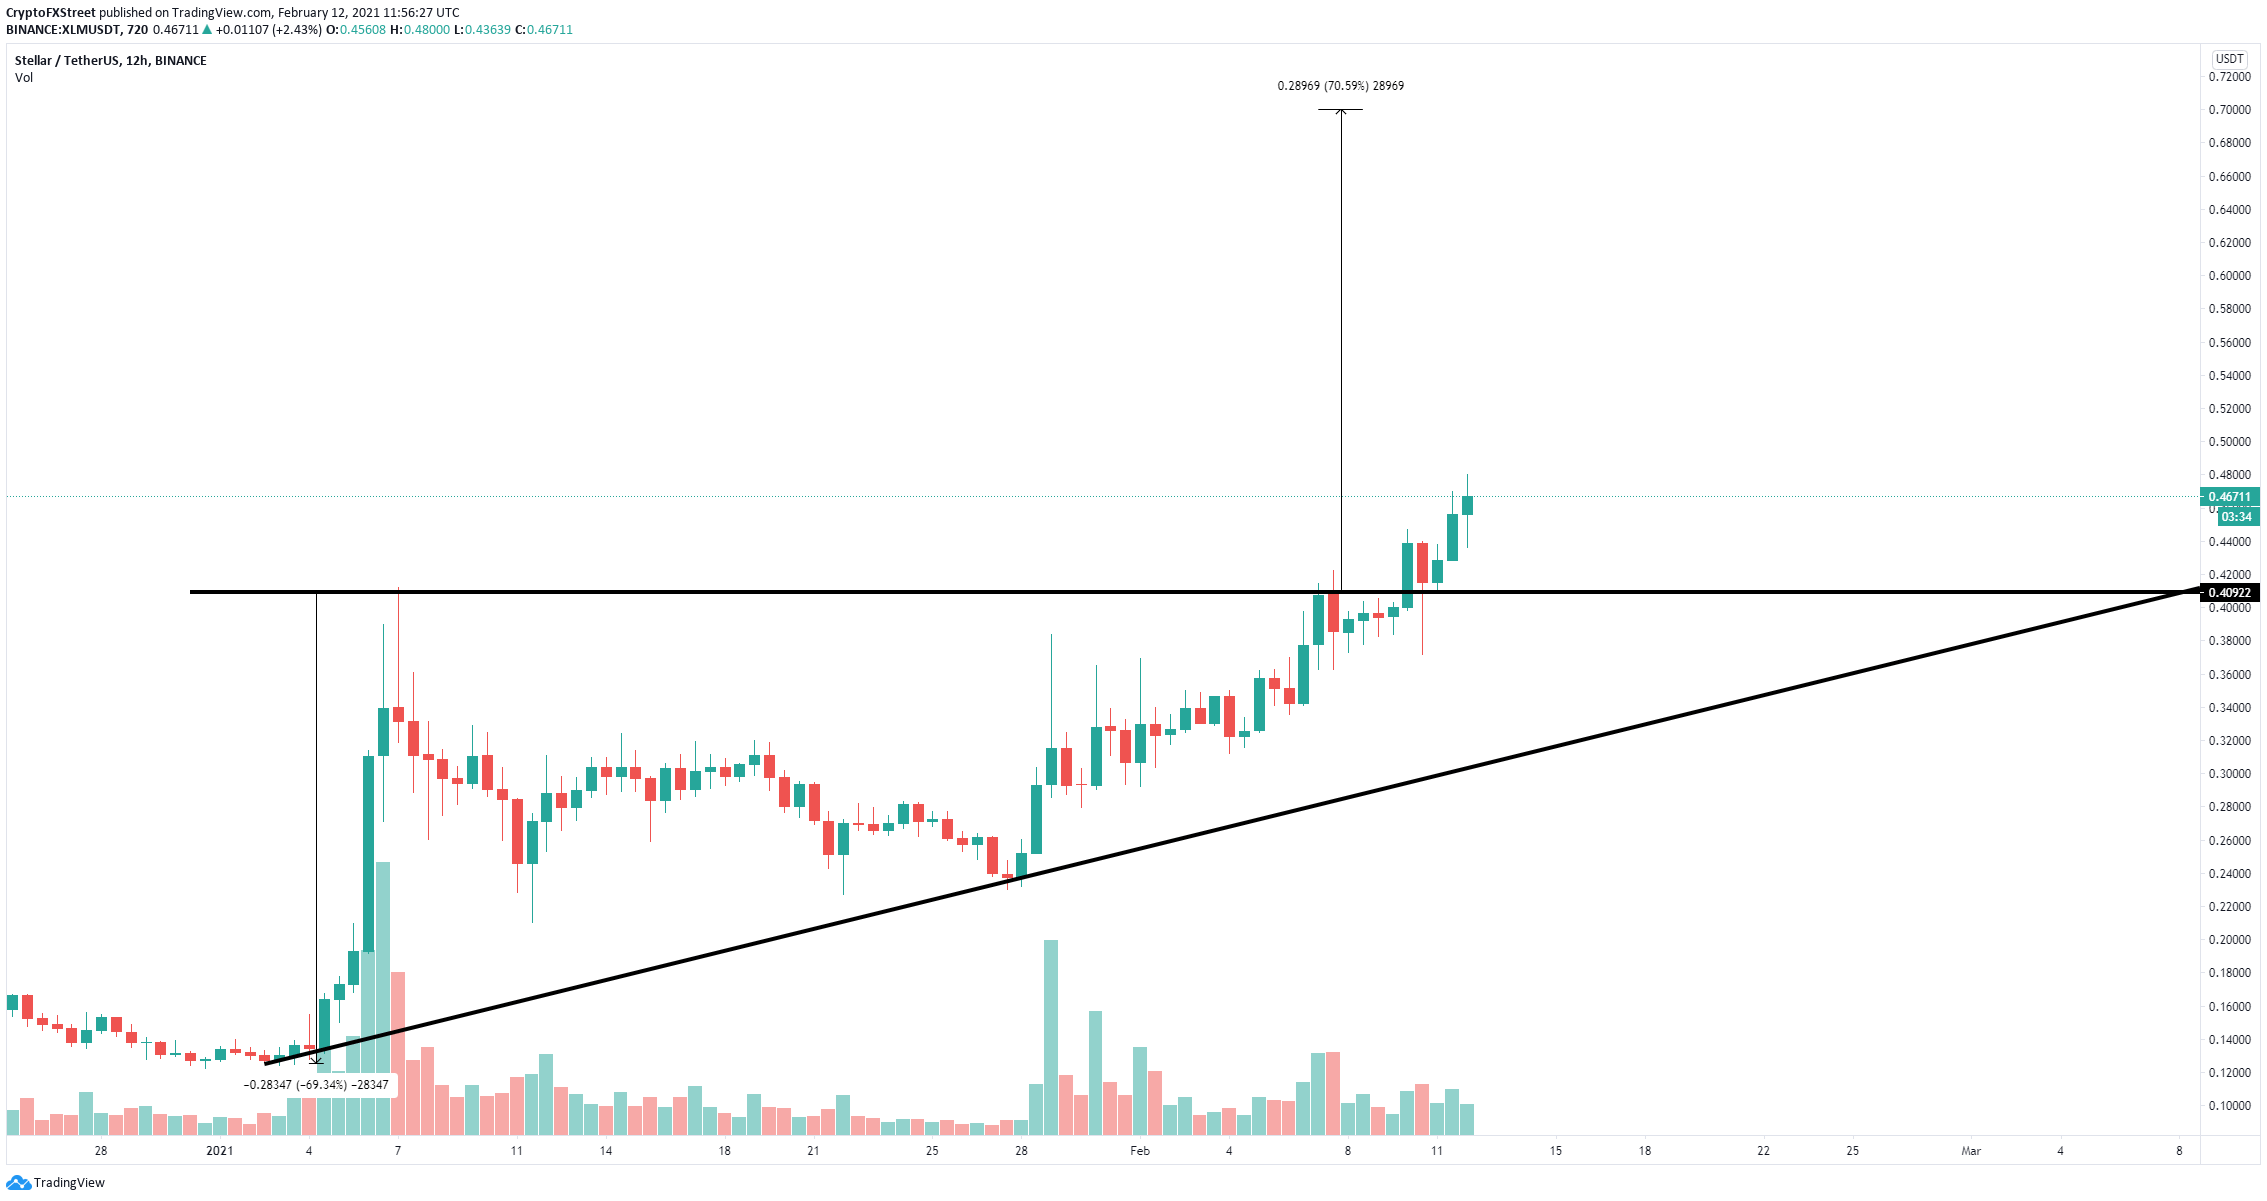
XLM/USD 12-hour chart
However, in the short-term XLM price can fall towards $0.446 if the key support level at $0.47 can’t be defended by the bulls. The lowest bearish price target would be $0.41 for a re-test of the previous resistance level on the 12-hour chart.
