- XLM price has been trading above the 26-EMA on the 12-hour chart for the past three weeks.
- Once again, the bulls have defended this point and aim for a significant rebound.
- A key indicator has presented a sell signal on the daily chart, increasing selling pressure.
Stellar climbed above the 26-EMA on the 12-hour chart on January 28 and hasn’t lost the support level since then. In the past 24 hours, the entire cryptocurrency market suffered a massive sell-off, but XLM bulls managed to hold the 26-EMA once again, with a significant 27% rebound.
XLM price on its way to $0.70 again as it faces no barriers
On the 12-hour chart, every time XLM price touched the 26-EMA or was close to it, it had a significant rebound in the next 24 hours. Once again, XLM touched the 26-EMA but managed to rebound strongly.
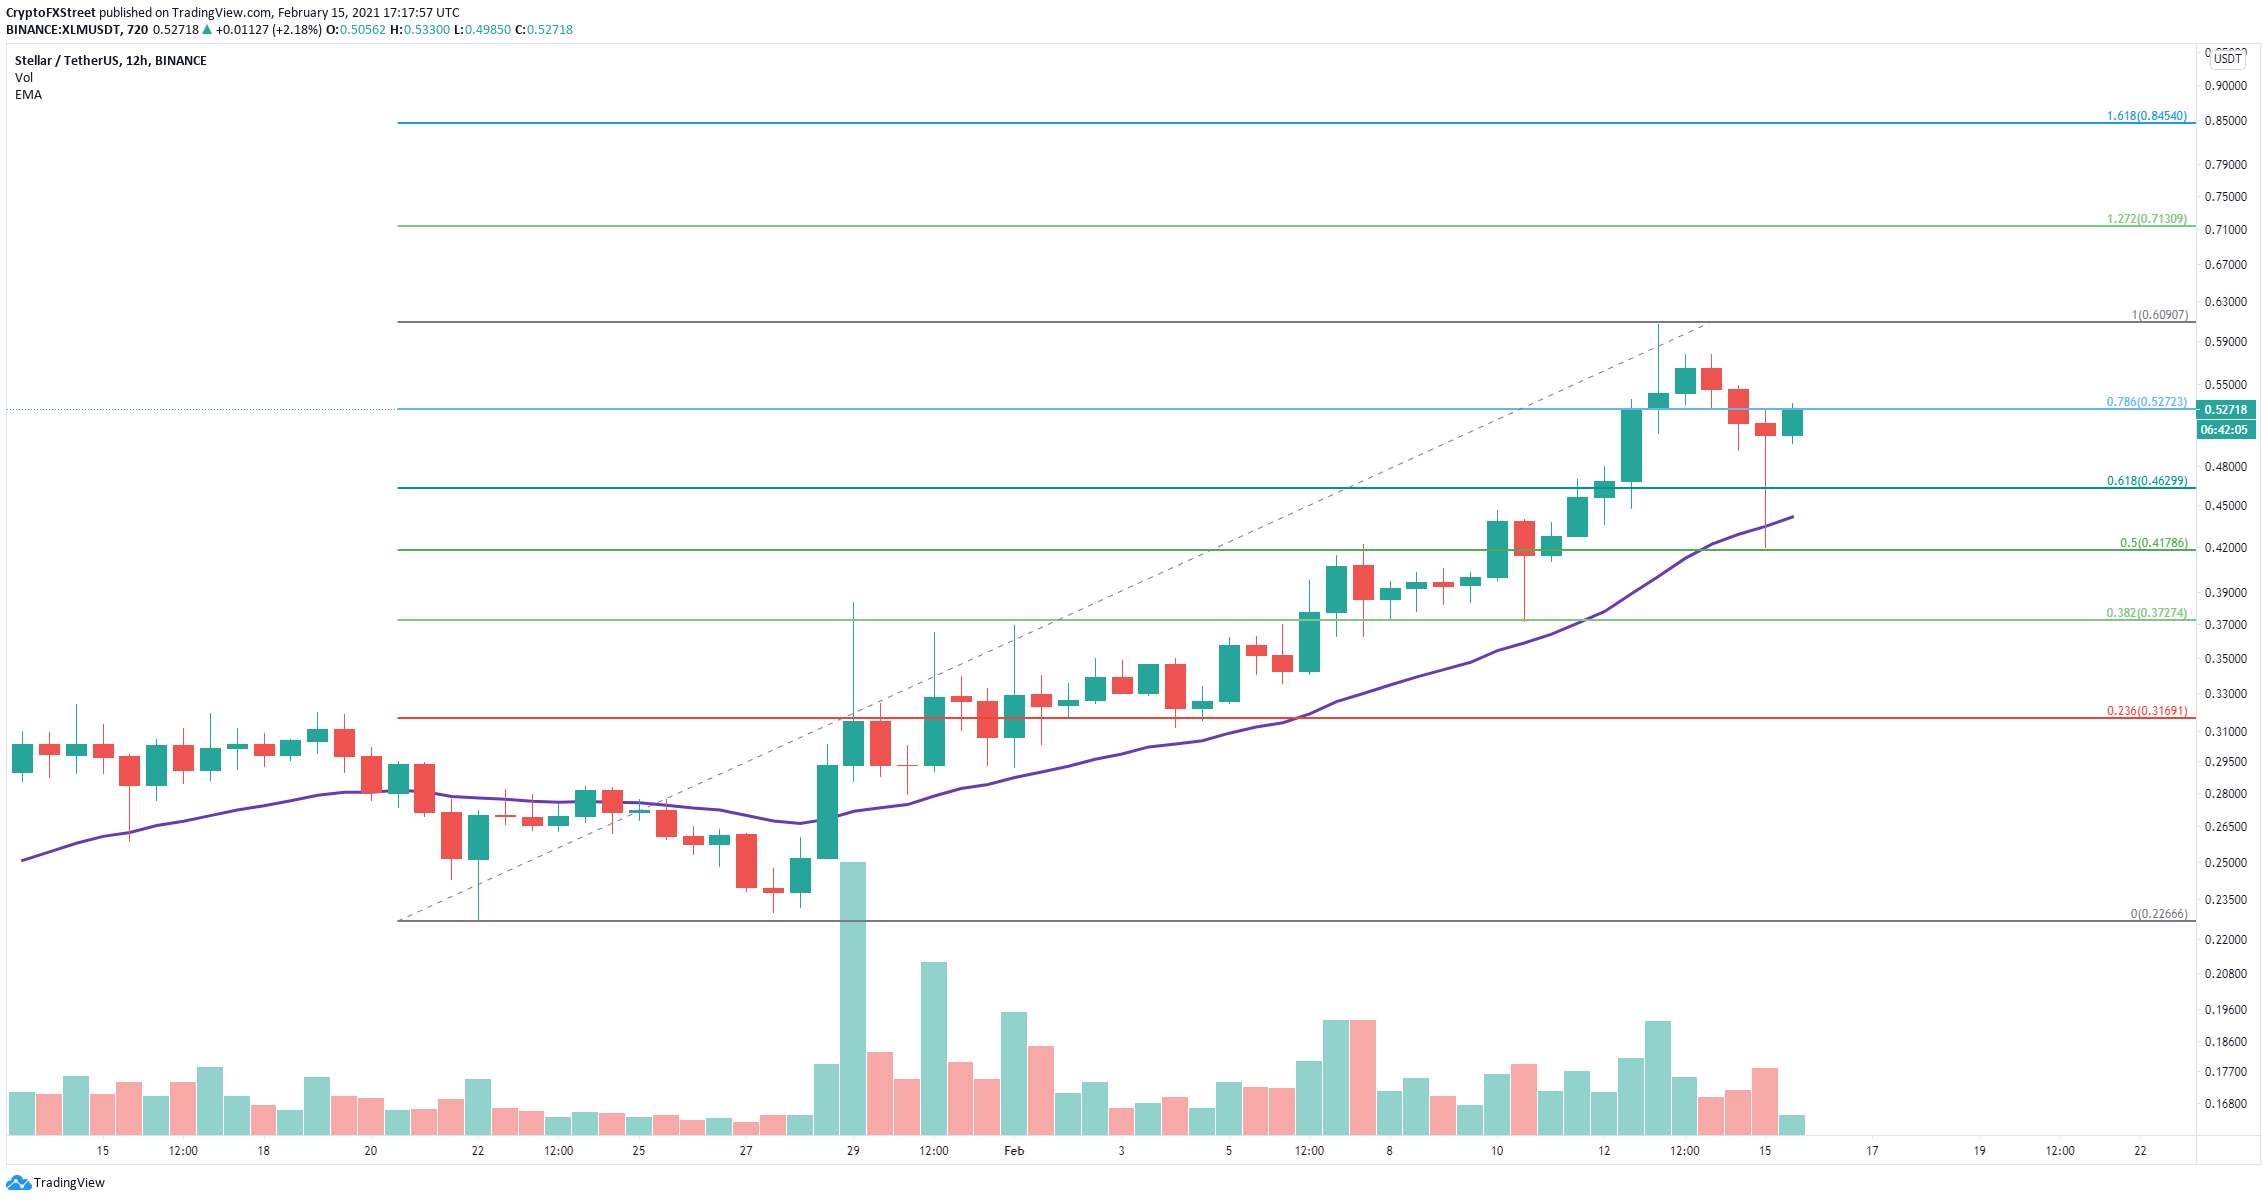
XLM/USD 12-hour chart
The only significant resistance level is the previous high of $0.606. A breakout above this point can quickly push XLM price up to $0.71 at the 127.2% Fibonacci level. In the long-term, XLM can even climb towards $0.845 at the 161.8% fib level.
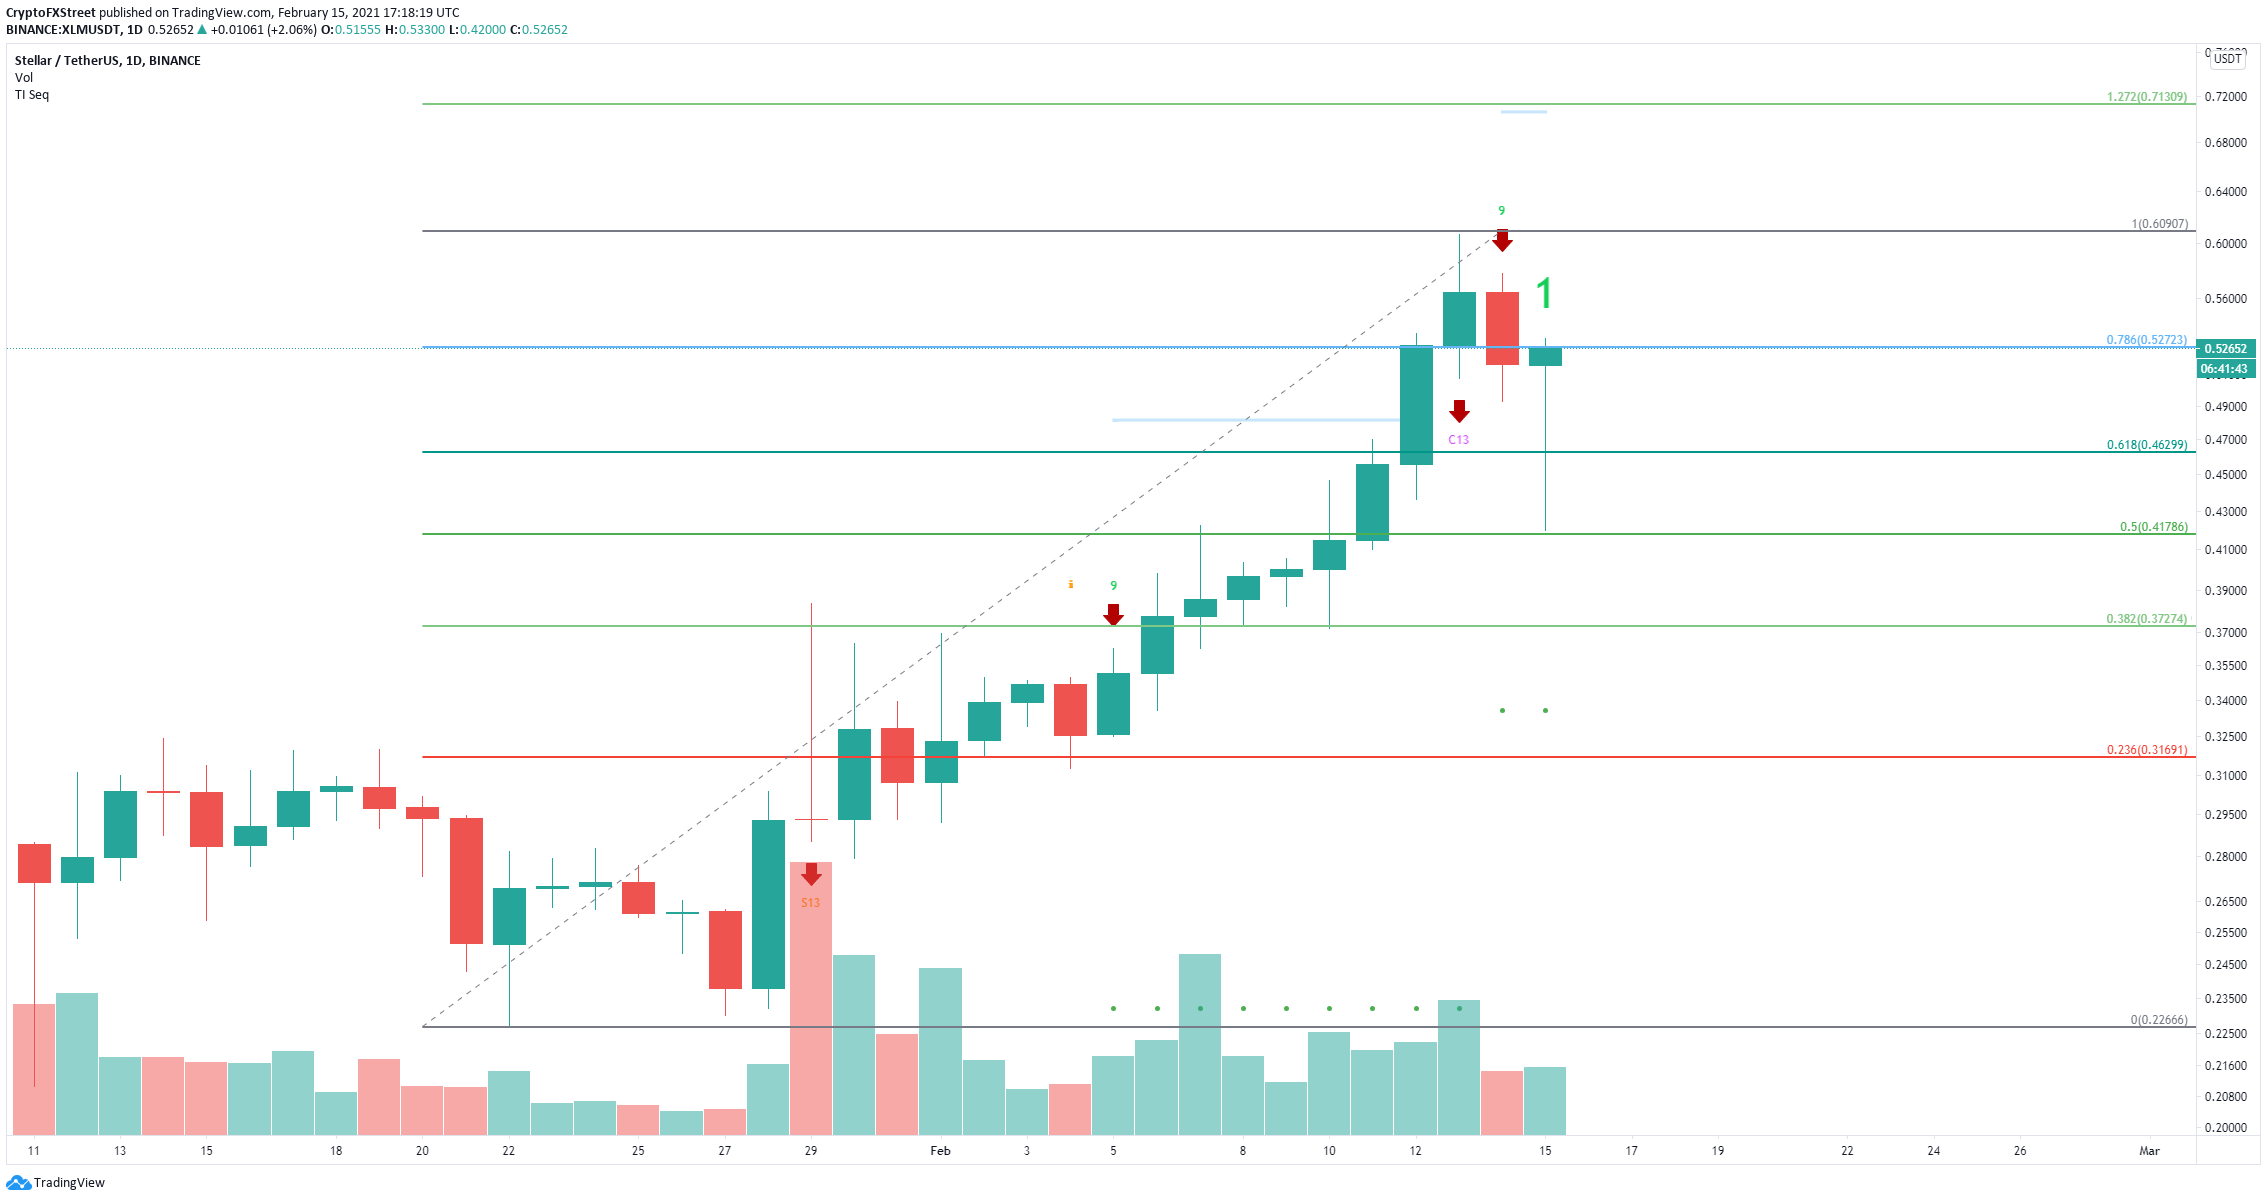
XLM/USD daily chart
However, on the daily chart, the TD Sequential indicator has just presented a sell signal that had a lot of continuation with the most recent sell-off. XLM price touched $0.462, the 61.8% level, and $0.41, the 50% fib level. Both of these two levels can be revisited again if the bearish momentum continues.
