- Cosmos price had a significant 200% rally to $26.55 on February 16.
- The digital asset is potentially bound for a short-term correction after such a run.
- A key indicator has presented a sell signal on the 4-hour chart.
Since the beginning of February, Cosmos price has increased by more than 200% reaching a potential local top of $26.55. The digital asset seems poised for a pullback considering the magnitude of the previous rally.
Cosmos price can dive towards $21.7 in the short-term
On the 4-hour chart, the TD Sequential indicator has just presented a sell signal at the top which indicates that Cosmos price could be poised for a correction. Using the Fibonacci Retracement tool, we can calculate several price targets for the bears.
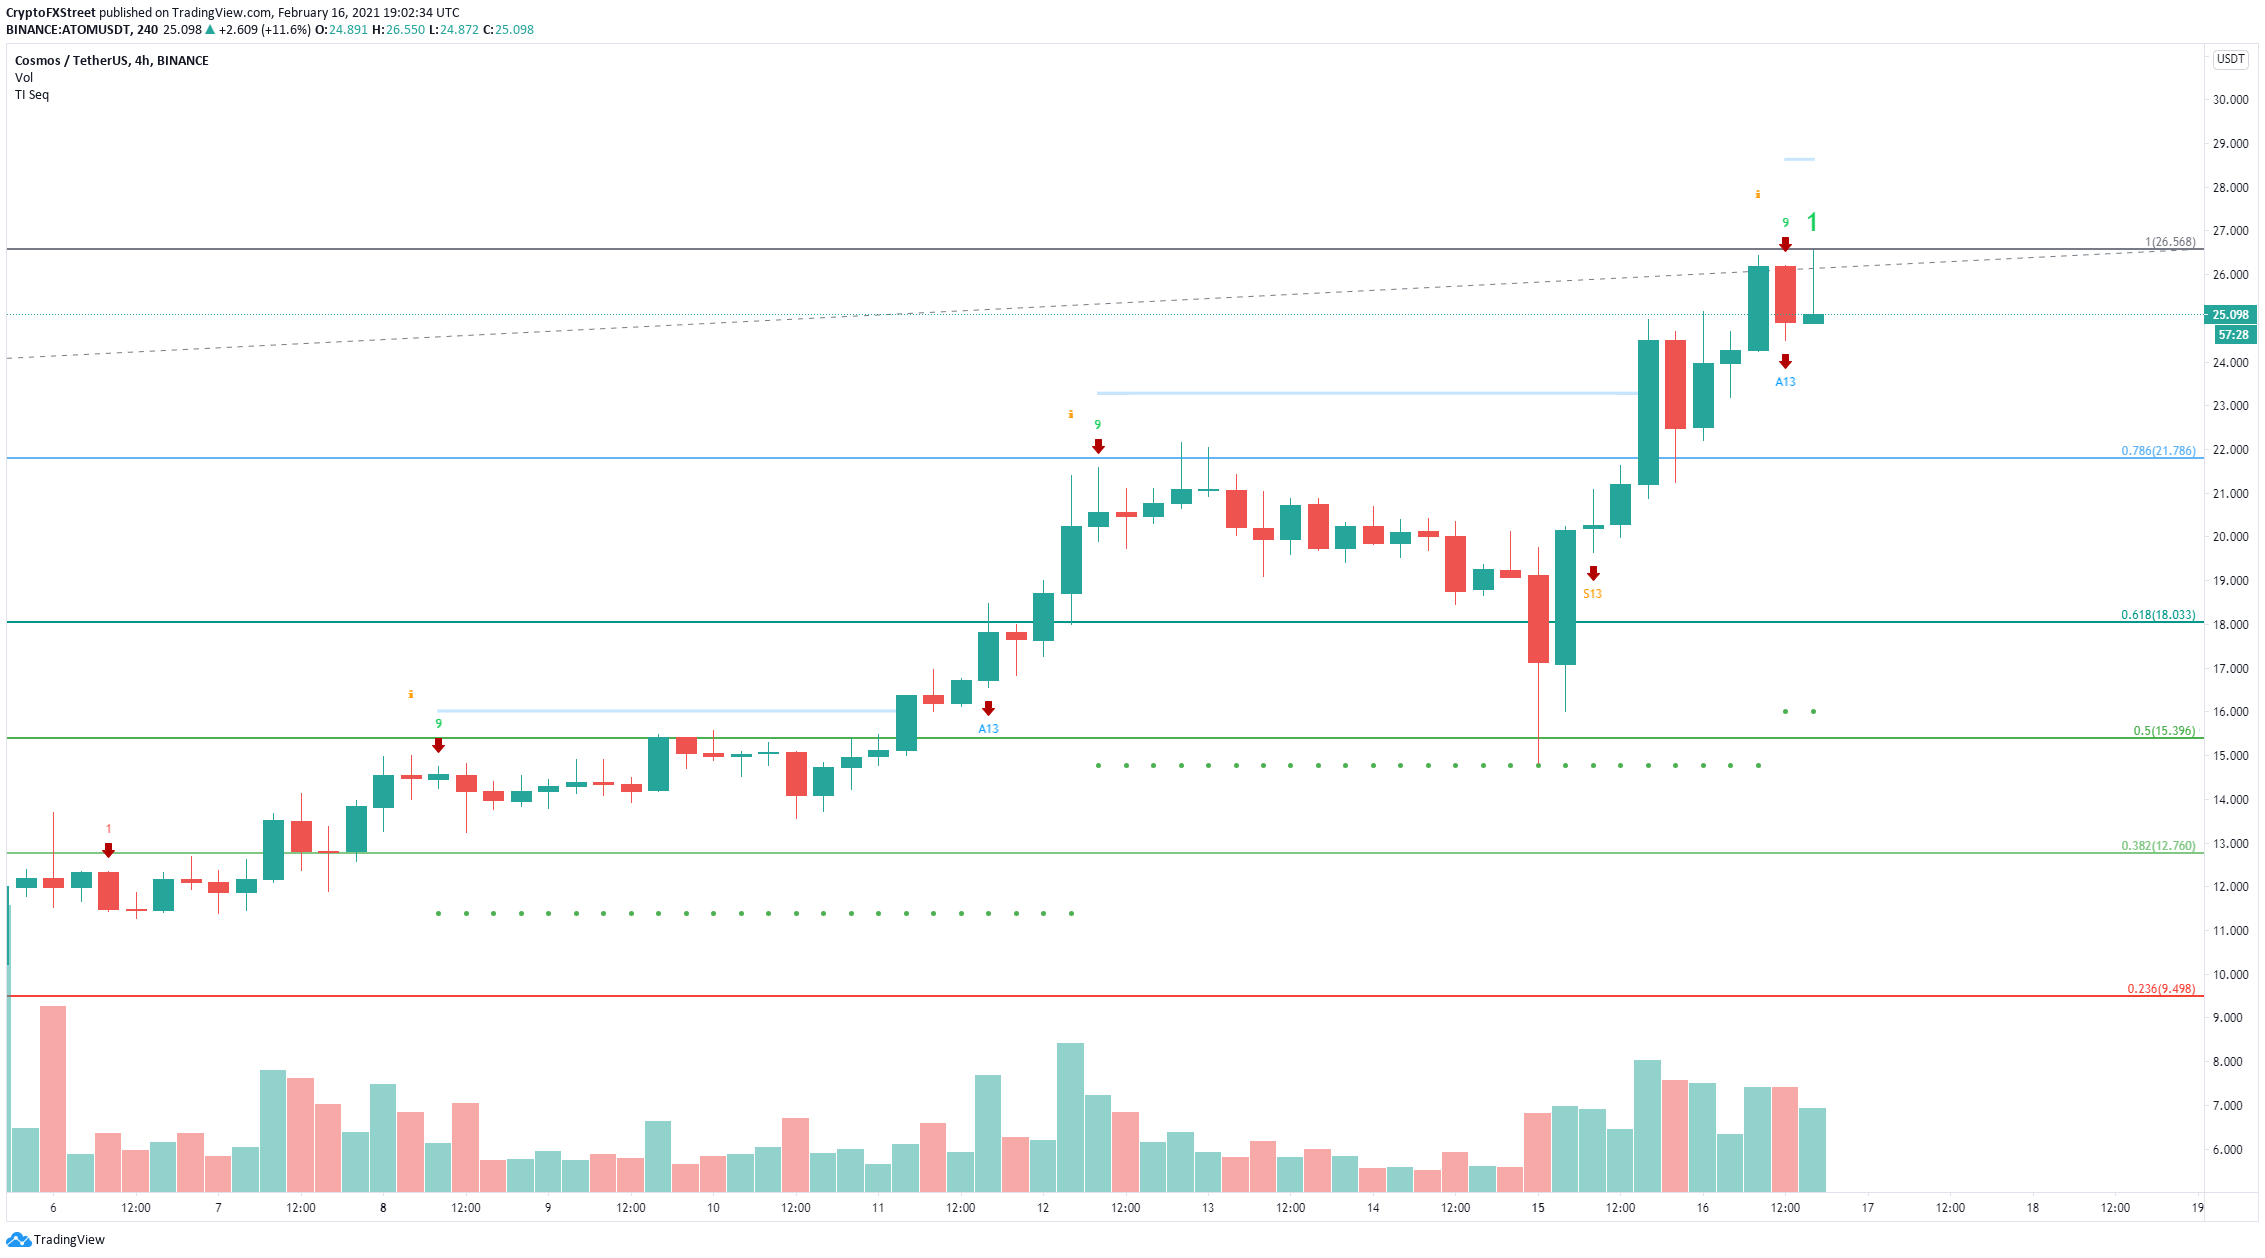
ATOM/USD 4-hour chart
The nearest price target is $21.78 which is the 78.6% fib level followed by $18 at the 61.8% point. Losing both levels would drive Cosmos price down to $15.39 at the 50% Fibonacci retracement level.
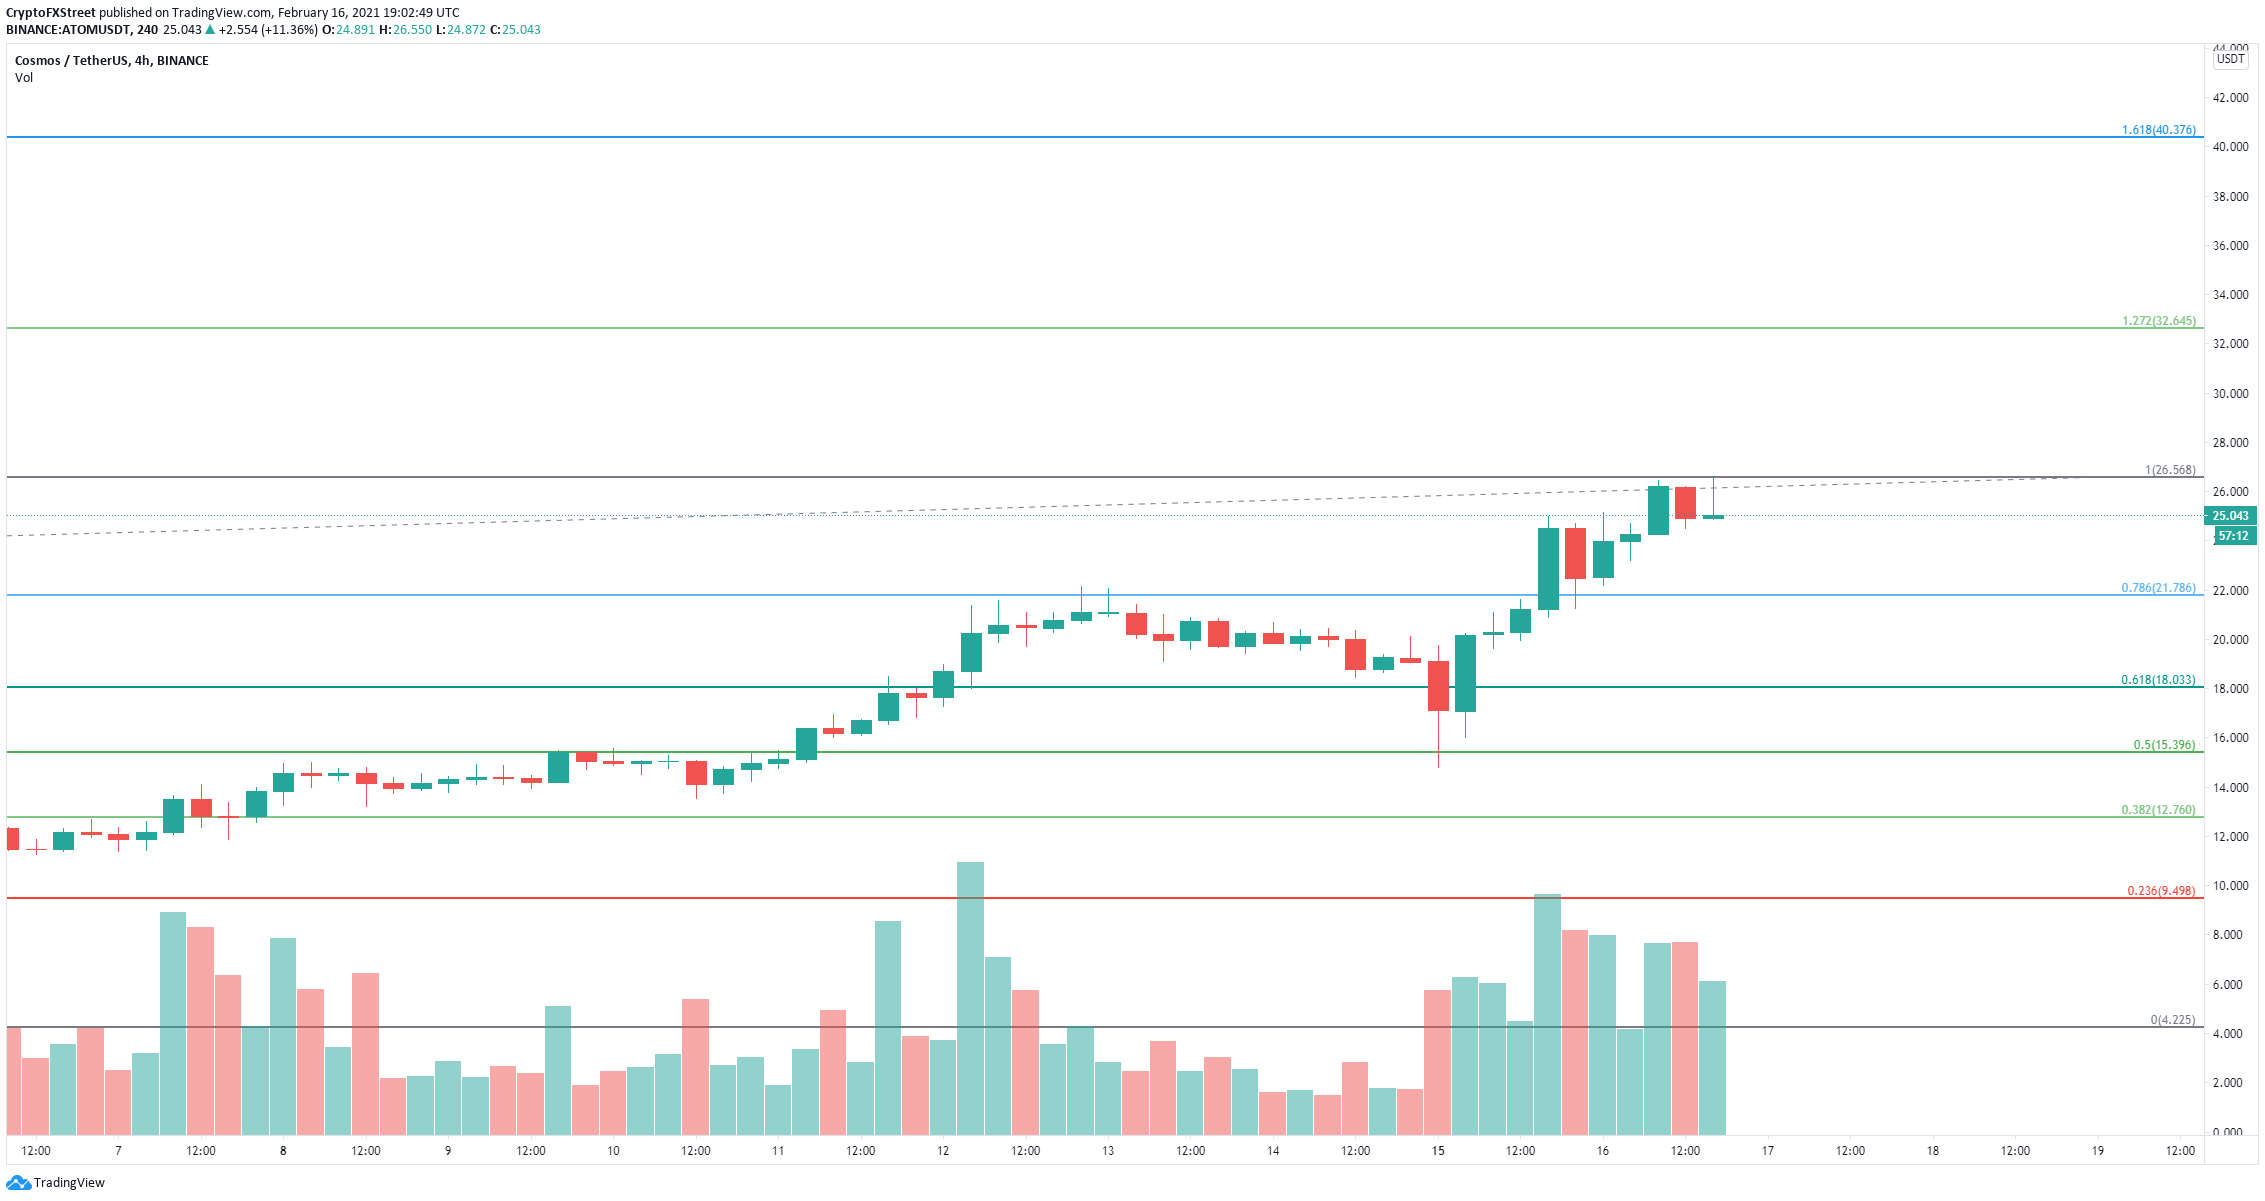
ATOM/USD 4-hour chart
To invalidate the bearish outlook and sell signal, ATOM bulls must push Cosmos price above the high at $26.2 with a 4-hour candlestick close. A breakout above $26.55 would drive Cosmos up to $32.64, at the 127.2% Fibonacci level.
