- Aave price is on the verge of a significant breakout towards $600.
- A key indicator has presented two strong buy signals in favor of the digital asset.
- There are no significant barriers on the way up for Aave.
Aave has seen a notable 30% correction since its top at $581.66 on February 10. The digital asset now seems ready for a new leg up and a breakout above $450.
Aave is facing only one barrier before $600
On the 12-hour and 4-hour charts, the TD Sequential indicator has presented two strong buy signals. There is one key resistance level at $450, which is the 26-EMA on the 12-hour chart.
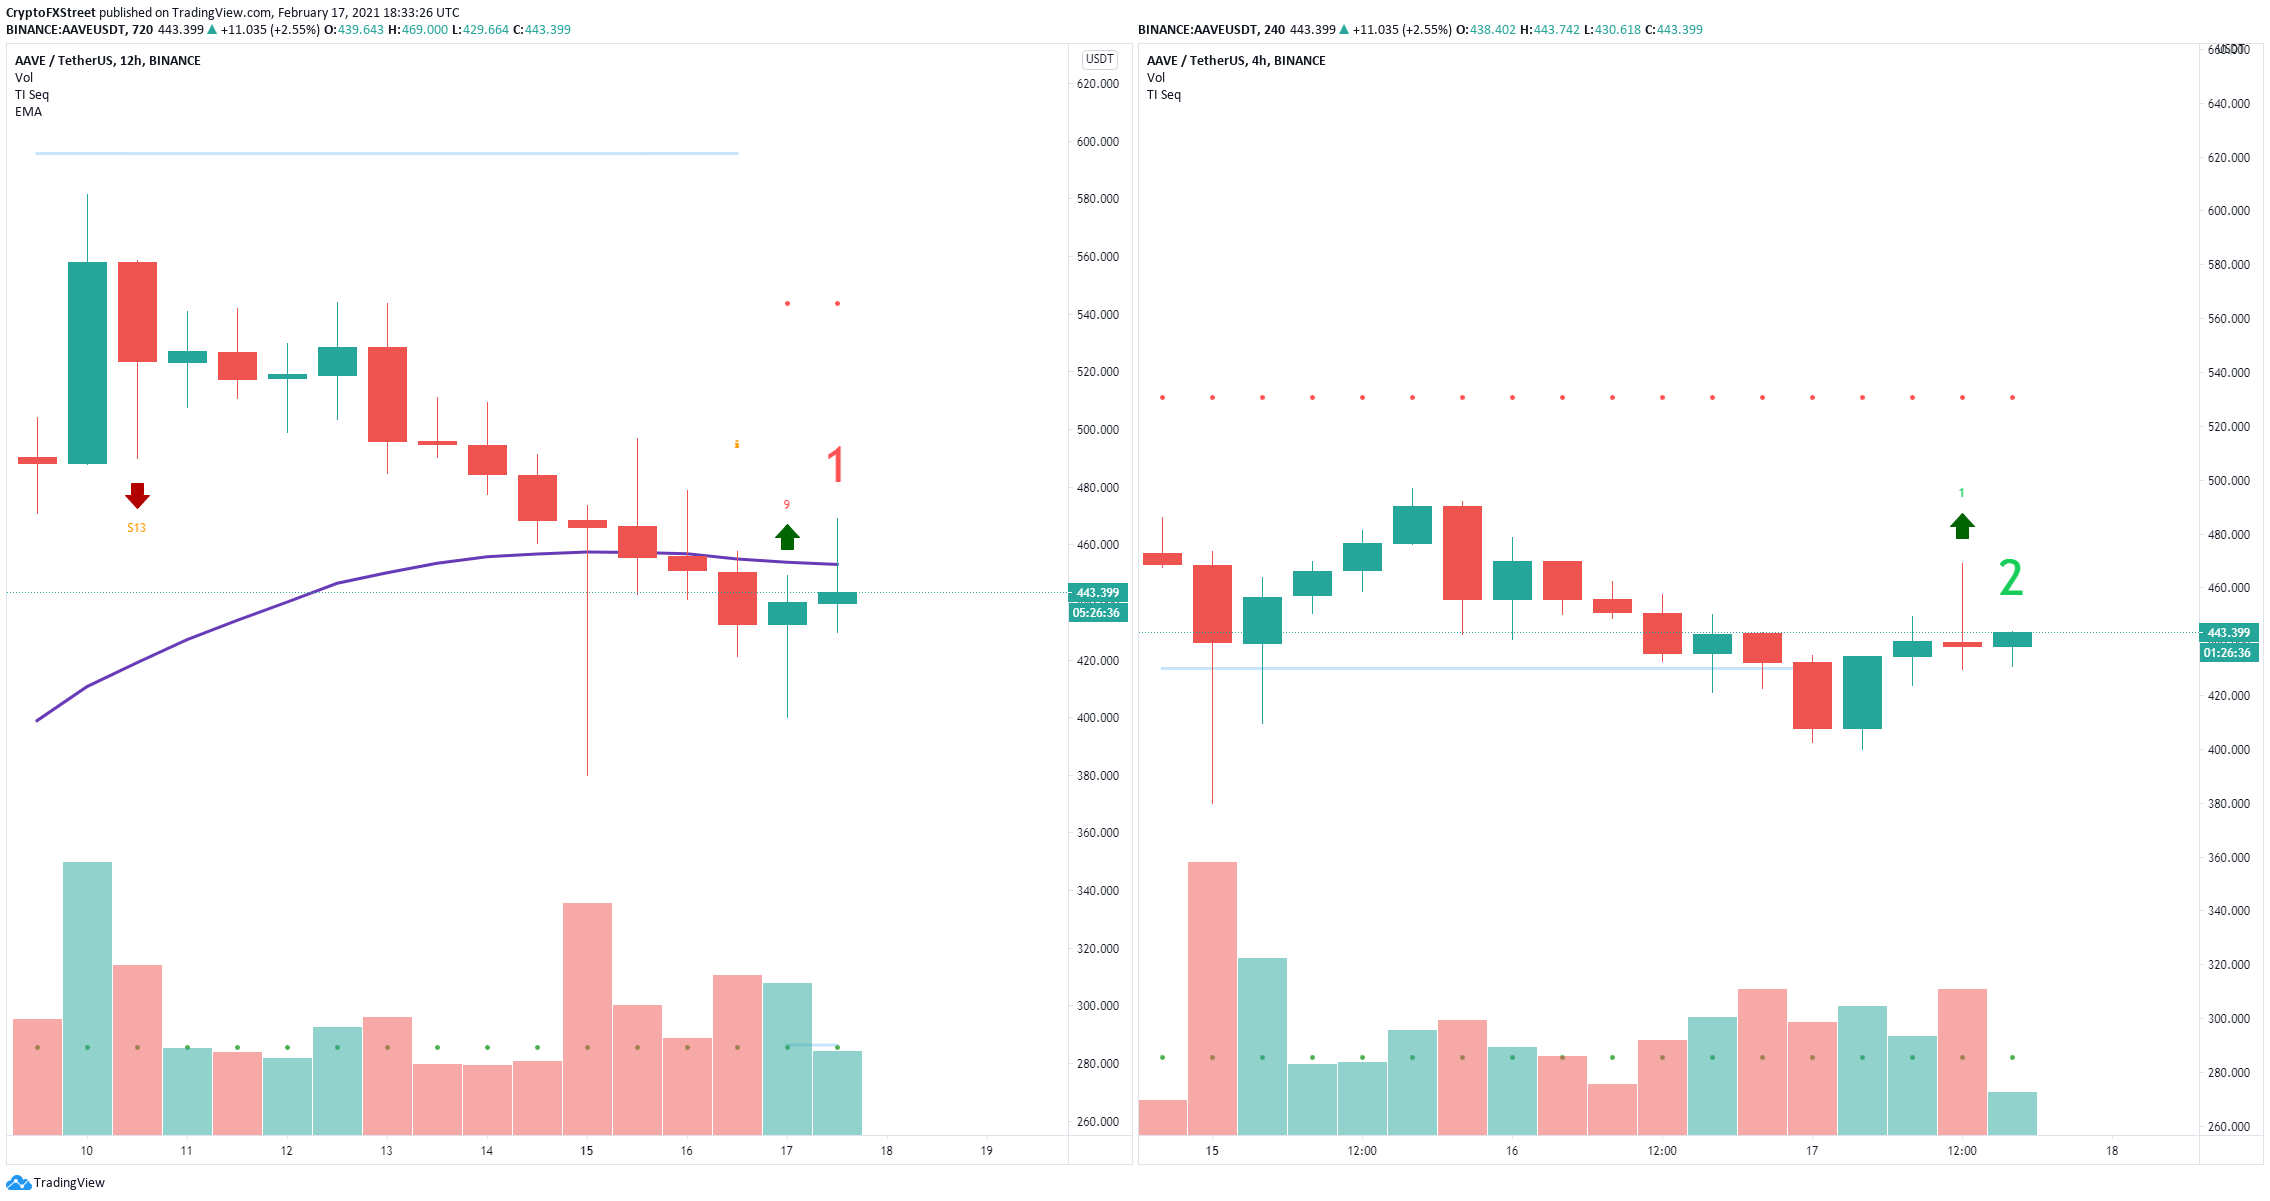
AAVE/USD buy signals
However, the In/Out of the Money Around Price (IOMAP) chart shows practically no intense resistance levels ahead. The strongest seems to be located between $493 and $507, where 5,430 addresses purchased over 560,000 AAVE coins. A breakout above $500 can quickly drive Aave price towards $600.
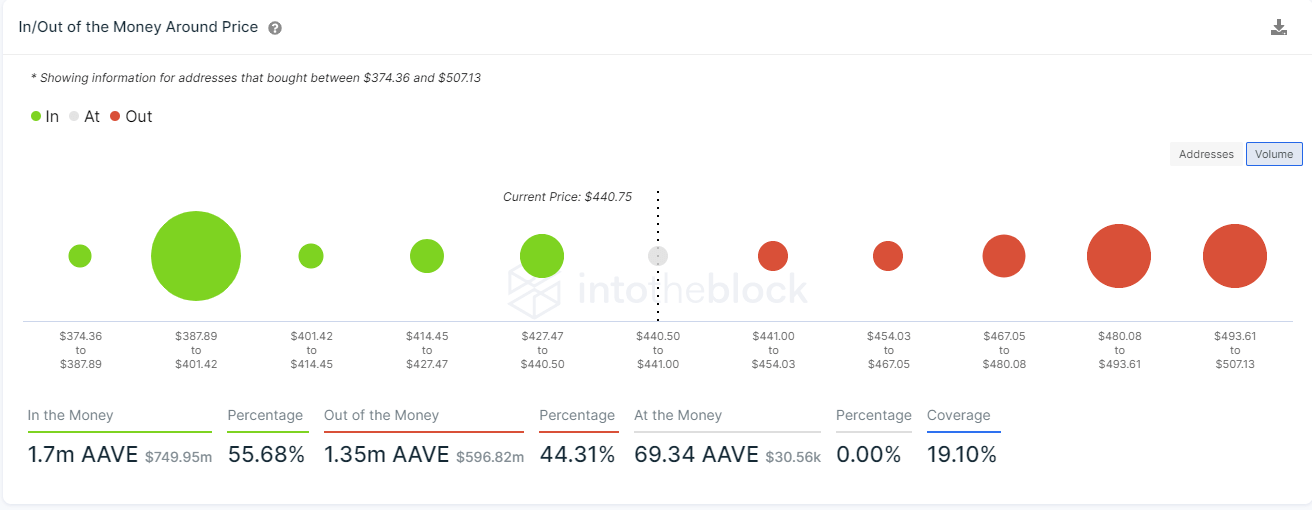
AAVE IOMAP chart
However, a rejection from the 26-EMA resistance level at $450 on the 12-hour chat and a close below $400 would invalidate the bullish outlook and drive Aave towards $300. The IOMAP model shows only one key support area between $387 and $401, which coincides with the levels above.
