- Bancor majestic rally on hold after meeting resistance at $6.28, but on-chain metrics hint at another upswing.
- The dwindling exchange supply means the increasing demand from the whales will support another rally.
- BNT could drop to $2.83, August 2020 high, if support above $5 is not secured.
Bancor’s price has rallied over 120% from its former all-time high and 1,165% from the lows in November 2020. The persistent rise in value has kept investor interest high in the altcoin, at the time of writing exchanging hands at $5.58. The bulls’ attention has now been channelled to seeking higher support before resuming the rally backed by on-chain metrics.
Bancor whales on a wild buying spree
As Bancor rallied to new all-time highs, whales within the project massively filled their bags. The buying spree is still on track, according to the on-chain data by Santiment. Addresses holding between 100,000 and 1 million coins have increased 43 to nearly 60 in 30 days, representing a 28.3% rise. Consequently, addresses containing between 1 million and 10 million coins shot up by three from 19 to 21 in the same period.
%20%5B12.44.46,%2019%20Feb,%202021%5D-637493271260599425.png)
Bancor holder distribution
Bancor’s dormant tokens have also been on the move over the last 30 days. According to Santiment, “this dip in the average time dollars have been invested is a fantastic foreshadower for price rises.”
%20%5B12.47.35,%2019%20Feb,%202021%5D-637493271309852467.png)
Bancor mean dollar invested age
Over the last 90 days, the average supply of BNT on exchange platforms has dropped drastically. In other words, there are more long-term holders than short-term sellers in the market. As the supply dwindles, its relation with increasing demand is a perfect recipe for the continued upward price action.
%20%5B12.53.21,%2019%20Feb,%202021%5D-637493271377318407.png)
Coin supply on exchanges
Bancor price seeks higher support
The recent golden cross pattern whereby the 100 Simple Moving Average crossed above the 200 SMA suggests the trend is still in bulls’ hands. A little retreat from the all-time high of $6.28 needs support, preferably above $5, to sustain the uptrend. Breaking above the new record eye will pave the way for gains eying $10.
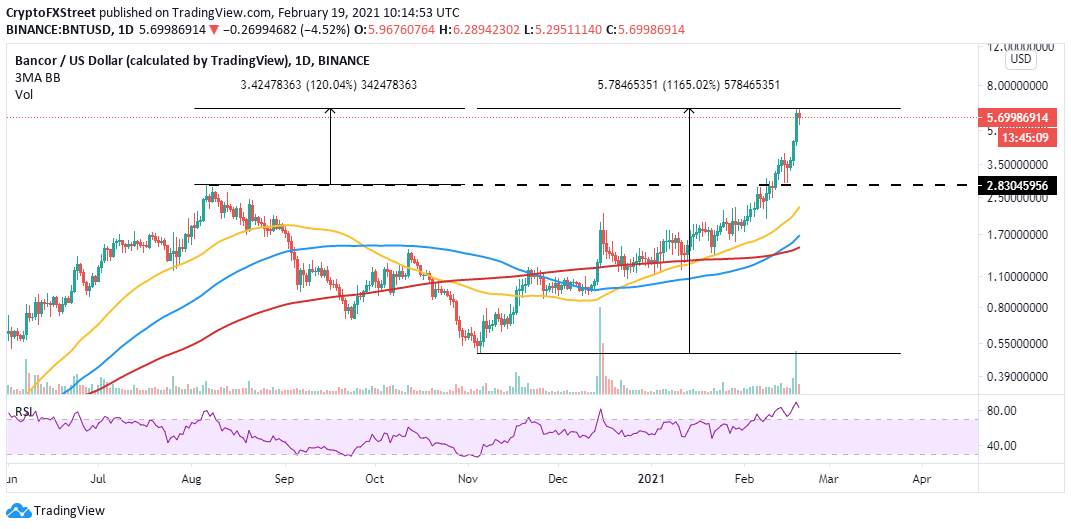
BNT/USD daily chart
Looking at the other side of the fence
It is worth noting that the Relative Strength Index on the daily chart is strongly oversold and retreating at the time of writing. Simultaneously, failure to secure support above $5.0 will trigger massive seller orders, resulting in a correction that could test $2.83 (August 2020 high) or the 50-day SMA.
