- Ethereum price gets squeezed as it approaches the end of a rising wedge pattern.
- A breakout from the wedge’s lower trendline signals a 40% drop on the horizon.
- Transactional data suggests the support level at $1,690 could cushion this drop.
- A bounce from this support level could eventually lead to the development of a bullish scenario.
Ethereum price has dropped approximately 10% since it hit a new all-time high at $2,034 on February 20. At the time of writing, ETH price is trading just above the lower trendline of the rising wedge, waiting to establish a direction.
Ethereum price performance might come undone soon
Since mid-January, Ethereum price has been forming series of higher highs and higher lows. Connecting the swing highs and swing lows show converging prices which results in a rising wedge pattern.
This technical formation projects a bearish outlook and the target is determined by measuring the distance from the breakout point to the first pivot low.
In Ethereum’s case, it is a 43% drop from $1,840 to $1,040. This target coincides with the 38.2% Fibonacci level.
Therefore, a decisive 6-hour candlestick close below $1,840 would confirm the end of a rising wedge pattern and signal the start of a downtrend.
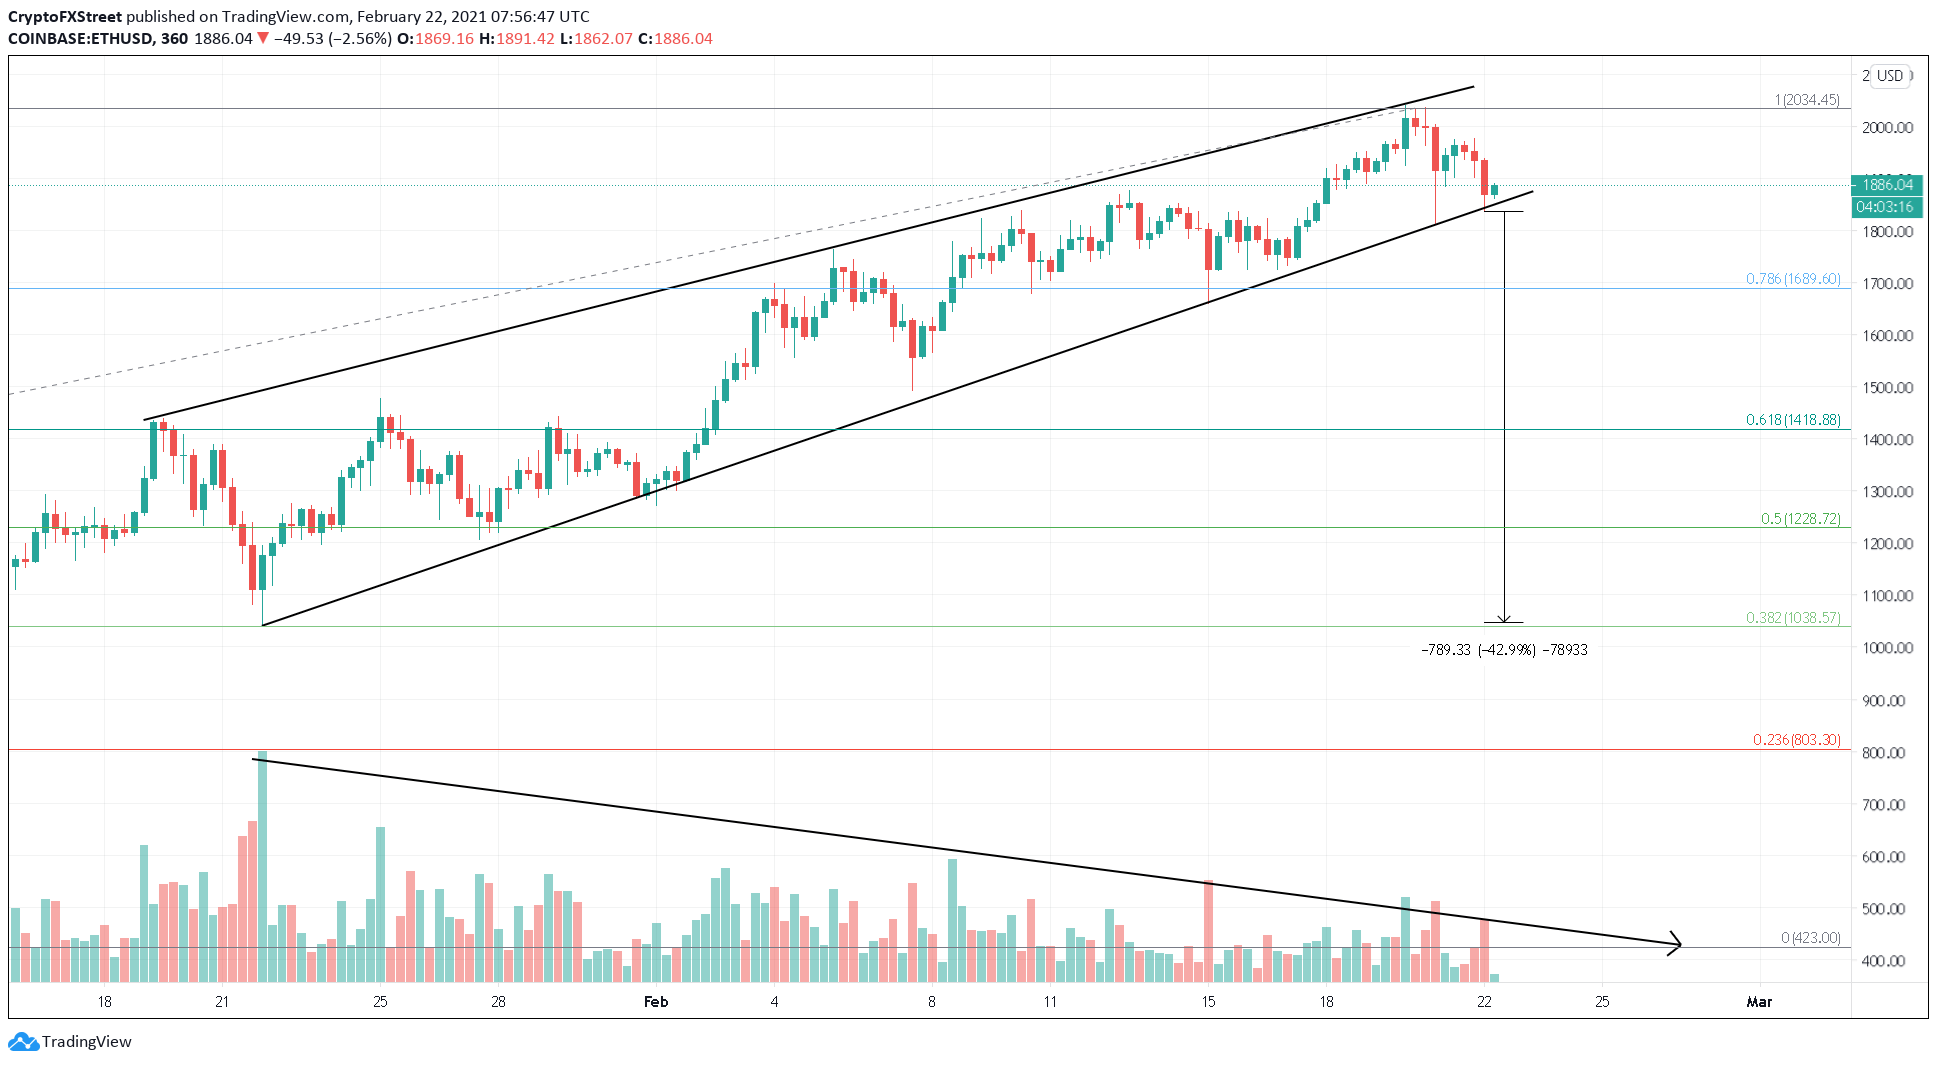
ETH/USDT 6-hour chart
However, IntoTheBlock’s Global In/Out of the Money (GIOMA) model shows the presence of stable support at $1,690. Here nearly 2 million addresses bought roughly 8.9 million ETH.
So, a breach of this demand barrier might seal the smart contracts platform’s fate and signal a drop to 38.2% Fibonacci retracement level at $1,040.
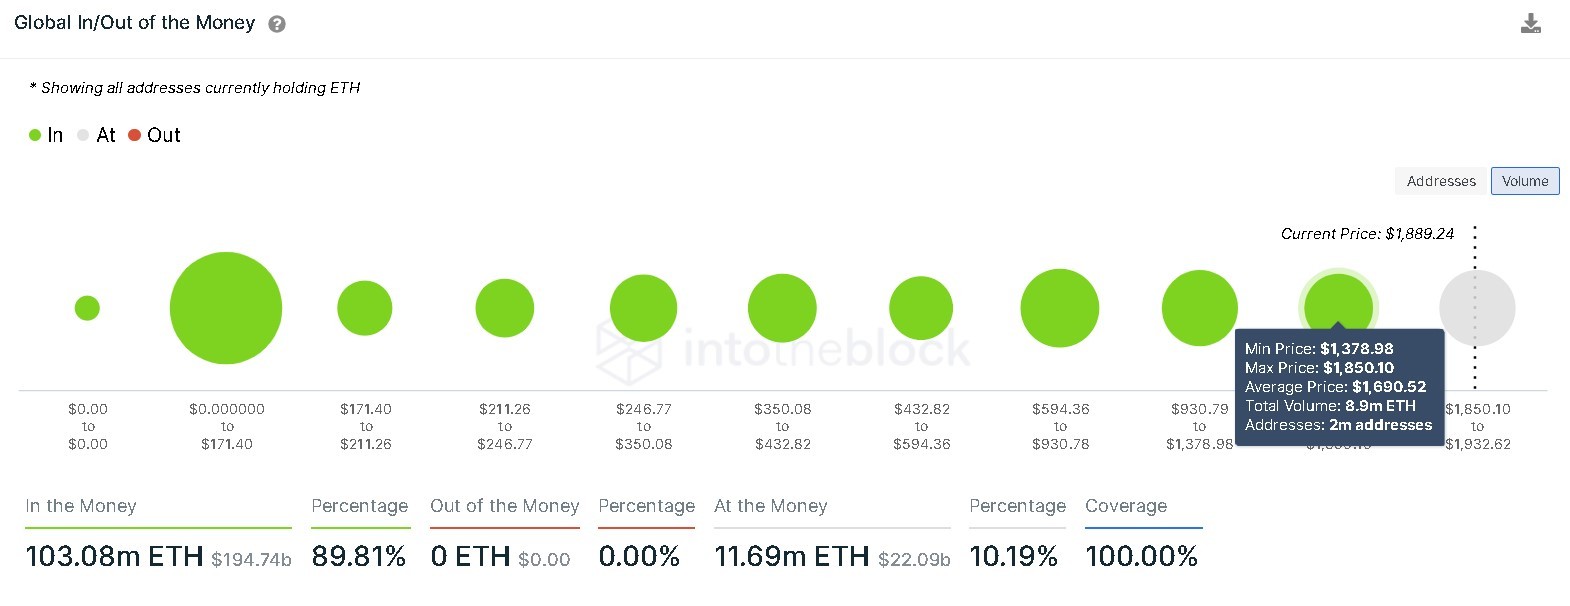
Ethereum GIOM chart
However, a bounce from the rising wedge’s lower trendline or even from the $1,690 support level could prevent this drop.
Additionally, if ETH closes above $1,965 on the six-hour chart, it would invalidate the bearish outlook due to the formation of a higher high. A spike in buying pressure here could allow ETH to retest the previous all-time high at $2,034
