- XLM/USD is teasing a symmetrical triangle breakout on the daily chart.
- RSI has also already charted an upside break; Sunday’s close is critical.
- A 60% upswing is in the offing if the bullish break is confirmed.
Stellar Lumens (XLM/USD) is awaiting a strong catalyst to break out from the recent tight range, having turned positive for the first time in four trading sessions.
The XLM buyers are prepared for a potential 60% move higher, with the technical setup favoring the upside. At the press time, the spot trades at $0.4114, up 1.24% during the past 24 hours.
XLM/USD: A test of the $1 mark is back on the buyers’ radar
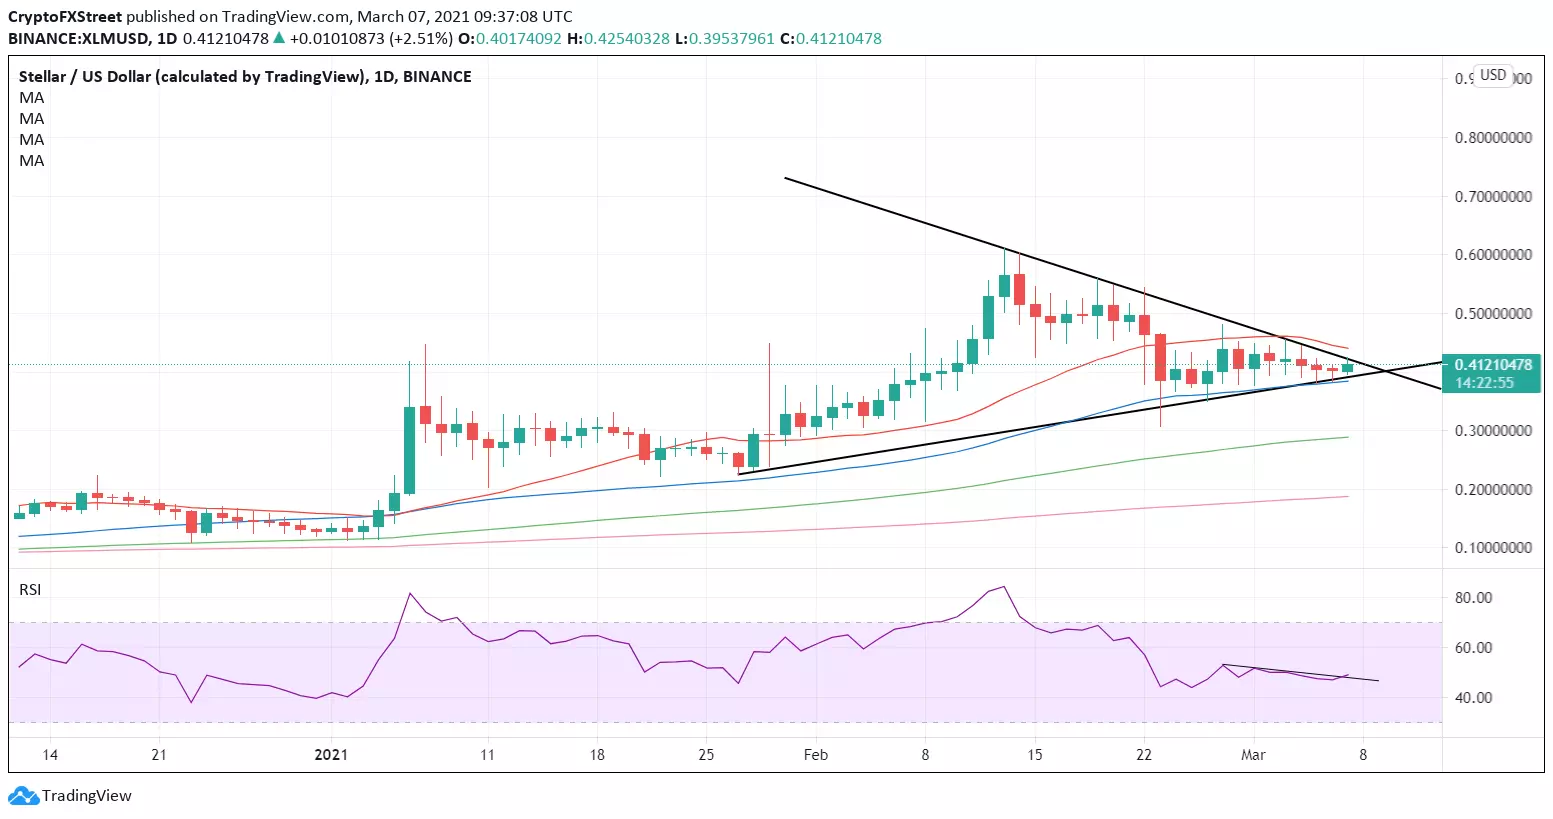
XLM/USD: Daily chart
XLM/USD is on the verge of confirming a symmetrical triangle breakout on the daily sticks. Therefore, the focus is on daily close above the falling trendline resistance at $0.4223.
The odds of an upside break are higher as the 14-day relative strength index (RSI) has already charted a breakout, although the bulls await confirmation.
The next immediate resistance for the XLM buyers is seen at the 21-daily moving average (DMA) of $0.4415.
Further up, acceptance above the psychological $0.50 barrier is critical to extending the run higher towards the $1 mark, which also coincides with the pattern target.
To the downside, the fierce cap is placed at the rising trendline support at $0.3967. A sustained move below the latter could yield a symmetrical triangle breakdown.
The bullish 50-DMA at $0.3882 could offer some temporary reprieve to the bulls. Sellers would then target the February 23 low at $0.3072.
