- ETH/USD picks up bids after bouncing off $1,837.
- Sustained trading beyond 200-SMA favors bulls inside short-term rising wedge formation.
- Two-week-old ascending trend line guards immediate upside, early March top adds to the downside filters.
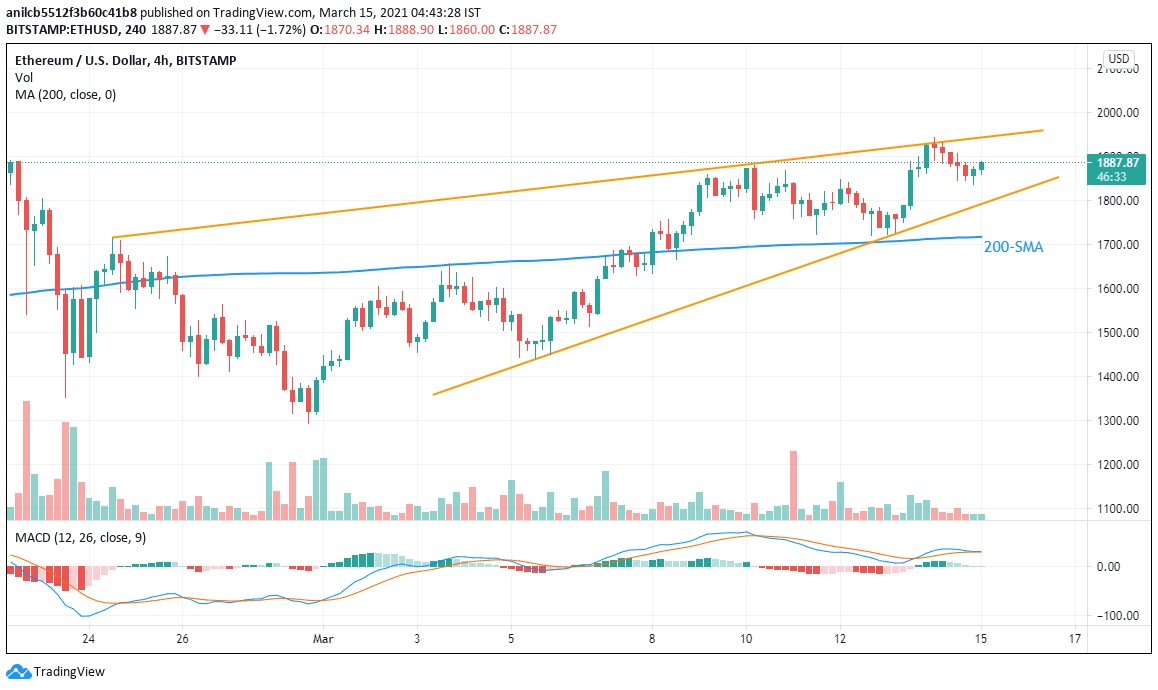
While extending recovery moves from $1,837, ETH/USD rises to $1,885 during early Monday’s trading. In doing so, the altcoin trades inside a two-week-old rising wedge bearish formation but recently trying to revisit the said bearish pattern’s upper line.
Given the quote’s successful break of 200-SMA and bullish MACD, backed by volume, ETH/USD buyers can eye for $1,945 comprising the stated resistance line.
However, the cryptocurrency pair’s run-up beyond $1,945 will reject the bearish chart formation and can easily conquer the record high marked in February around $2,040. During the rise, the $2,000 threshold may offer an intermediate halt.
Meanwhile, a downside break of $1,837 will eye for the stated pattern’s support line, at $1,790 now, a break of which will direct ETH/USD sellers to a 200-SMA level of $1,718.
In a case where the bears keep reins below $1,718, the $1,700 threshold and March 03 top surrounding $1,660 will be the key to watch.
Overall, ETH/USD bulls seem tiring near the record top but bears are waiting for confirmation.
ETH/USD four-hour chart
Trend: Pullback expected
