- XTZ/USD stands on a slippery ground, drops to the fresh low since March 05.
- A clear break of three-week-old support line joins bearish MACD and descending RSI to favor sellers.
- Monthly bottom can offer intermediate halt during the fall targeting late February lows.
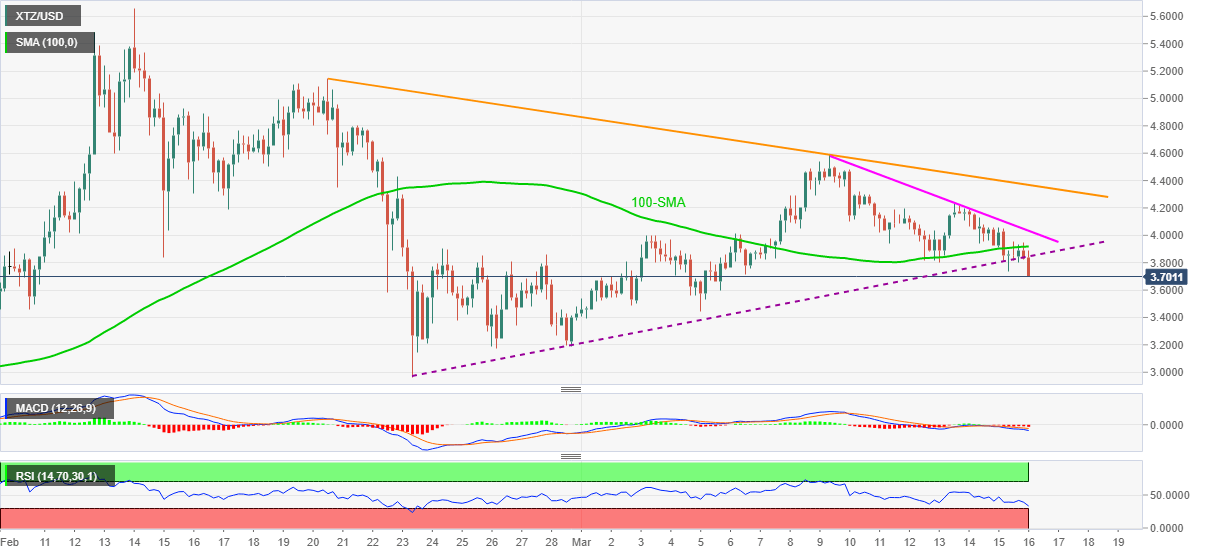
A clear break of an ascending trend line from February 23 favors XTZ/USD bears during early Tuesday. Not only the previous support break but bearish MACD and downward sloping RSI line also suggests further downside of the cryptocurrency pair, currently down over 3.0% near $3.71.
While the quote’s current downside aims for the monthly low near $3.44, February 26 low near $3.16 and February 23 bottom surrounding $2.96 are the ultimate targets for the XTZ/USD sellers.
It should, however, be noted that the XTZ weakness past-$2.96 will have to break below February’s low of $2.75 to keep the reins.
Alternatively, a corrective pullback beyond the stated support line, now resistance, around $3.84 will have to cross the 100-SMA level of $3.92 to convince short-term XTZ/USD buyers.
Though, descending resistance lines from March 09 and February 20, respectively around $4.03 and $4.37, will be the key to test the XTZ/USD bulls above the key SMA.
XTZ/USD four-hour chart
Trend: Further downside expected
