- VeChain price hints at a pullback after momentum reversal indicator (MRI) flashed a reversal signal.
- Now, VET could correct 13% to the 38.2% Fibonacci retracement level at $0.066.
- The sell-off might extend another 13% if the above barrier fails to hold.
VeChain price has been surging non-stop since hitting a local bottom on February 28. Now, VET could pullback before it establishes a clear direction.
VeChain price hints at a lower low
VeChain price has been consolidating inside an ascending parallel channel for almost three months. The 130% bull run has hit its target at $0.0835, creating a new all-time high for VET.
Now, the altcoin shows signs of retracement before establishing a new trend. VeChain could either continue its ascent and breach past the setup or correct to an immediate demand barrier.
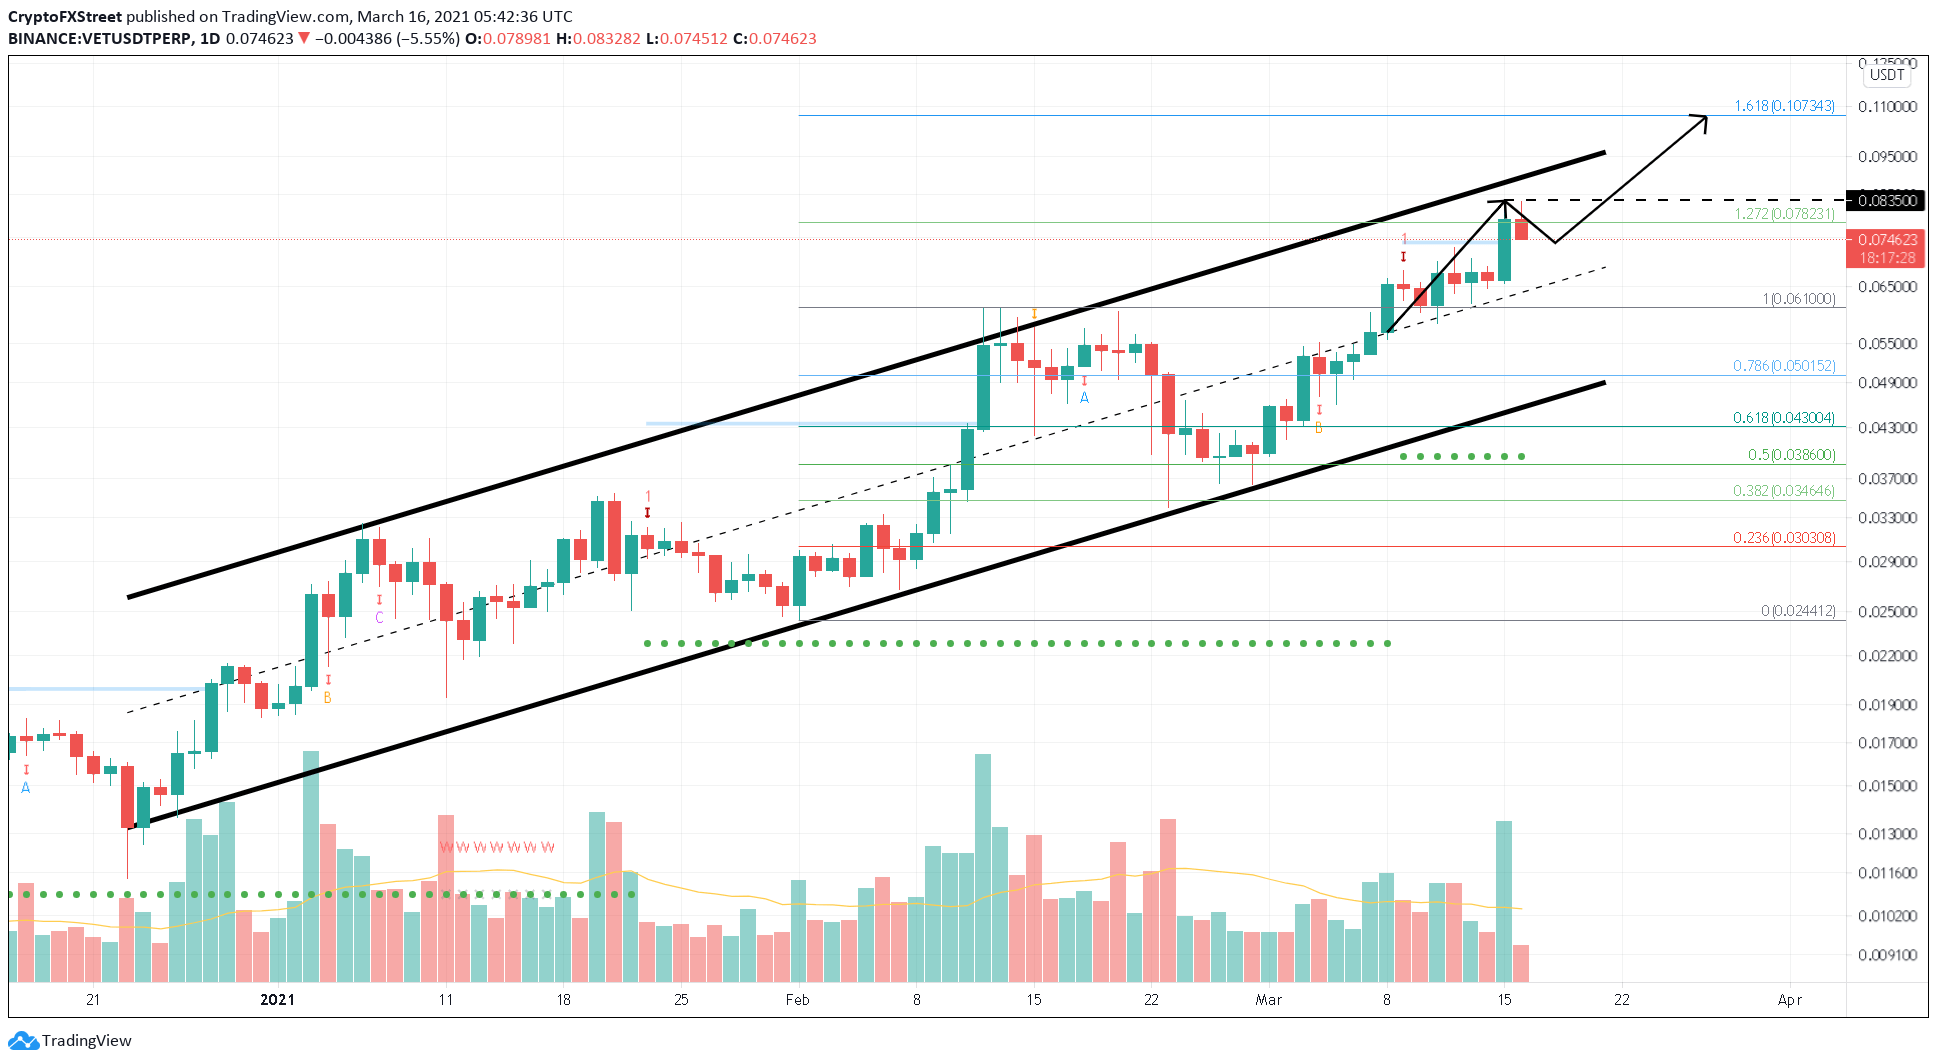
VET/USDT 1-day chart
Supporting the bearish scenario is the MRI’s “preemptive top” signal in the form of a yellow down arrow on the 4-hour chart. This setup forecasts a one-to-four candlestick correction.
So, VET’s logical course of action would be a 13% pullback to the parallel channel’s middle line, which coincides with the 38.2% Fibonacci retracement level at $0.066.
In case of excessive profit booking, sellers could extend the pullback to either the 50% or the 61.8% Fibonacci retracement levels at $0.062 or $0.058, respectively.
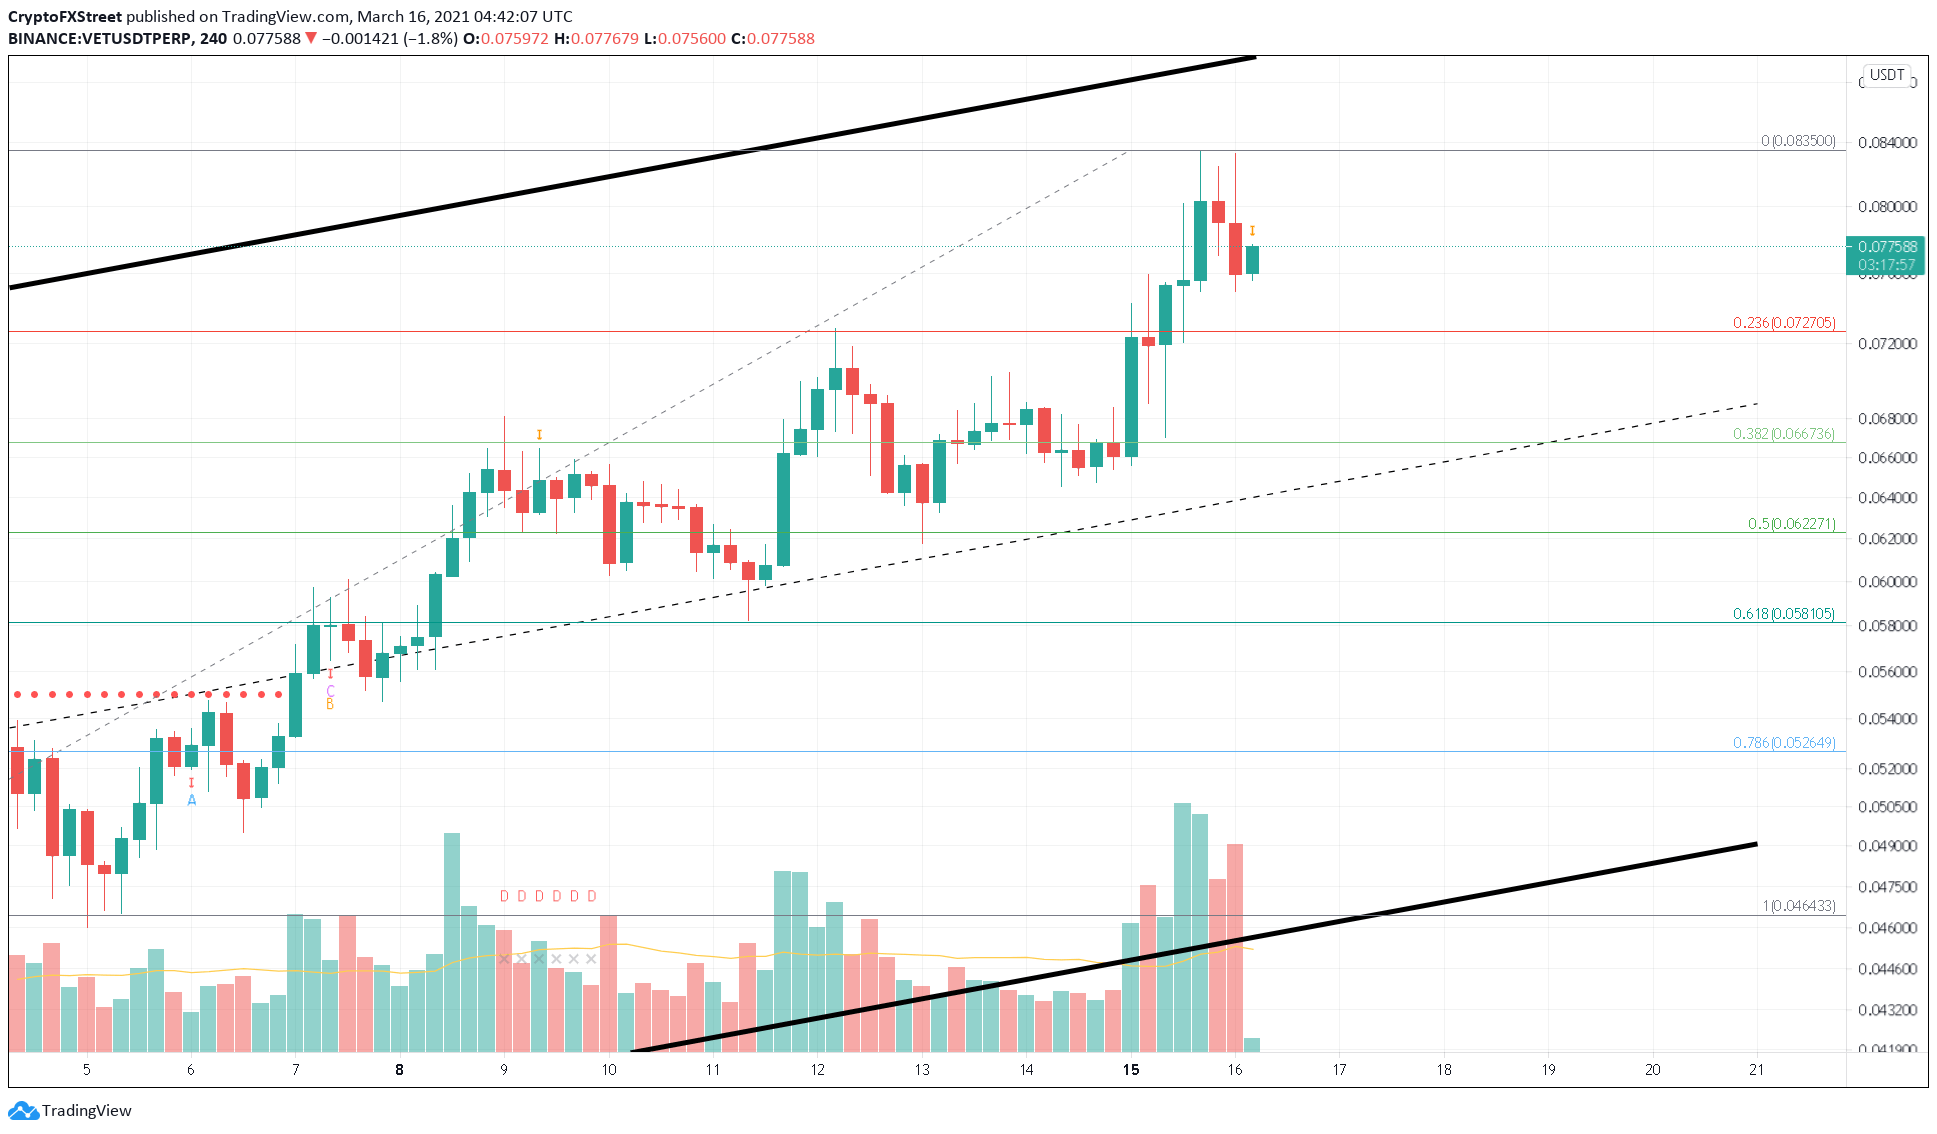
VET/USDT 4-hour chart
However, investors should note that VeChain price blasted through the breakout line around $0.074 on the daily chart, suggesting a massive spike in bullish momentum could follow. Therefore, a daily candlestick close above this level hints at a continuation of the bull rally.
In such a case, VET could ascend another 35% to $0.10, which coincides with the 161.8% Fibonacci retracement level seen on the 1-day chart.
