- QTUM price has held the 10-week simple moving average (SMA) since the beginning of the year.
- Relative Strength Index (RSI) near an overbought reading.
- $6.98 level causing headaches for traders on a weekly closing basis.
QTUM price has plunged 70% on two occasions since the beginning of February 2020, and each previous high has marked the beginning of a rising channel in QTUM. With the cryptocurrency struggling with resistance around $6.98, there is an increased probability that the cryptocurrency could retrace to the lower trendline of the channel, representing a 60% decline from current levels.
QTUM price distribution continues to undermine bullish traders
The decline in February-March 2020 was 77%, and the August-November 2020 crash was 69%. If precedent holds, QTUM may fall an additional 60% before touching the channel’s lower trendline.
Over the last six weeks, QTUM has reversed rally attempts above $6.98. The price level is in line with an area of price congestion going back to late-2017. With the RSI near overbought levels, there is a narrow window for momentum to lift prices higher.
The first price support comes at the 10-week SMA at $5.64, a support level going back to the beginning of this year. A weekly close below the moving average would be detrimental to the bullish outlook and favor a decline to the 40-week SMA at $3.30, followed by a test of the channel’s downside trendline at $2.72. The trendline’s touch would represent a decline of 70% from the February high at $9.68 and a 60% decline from current price levels.
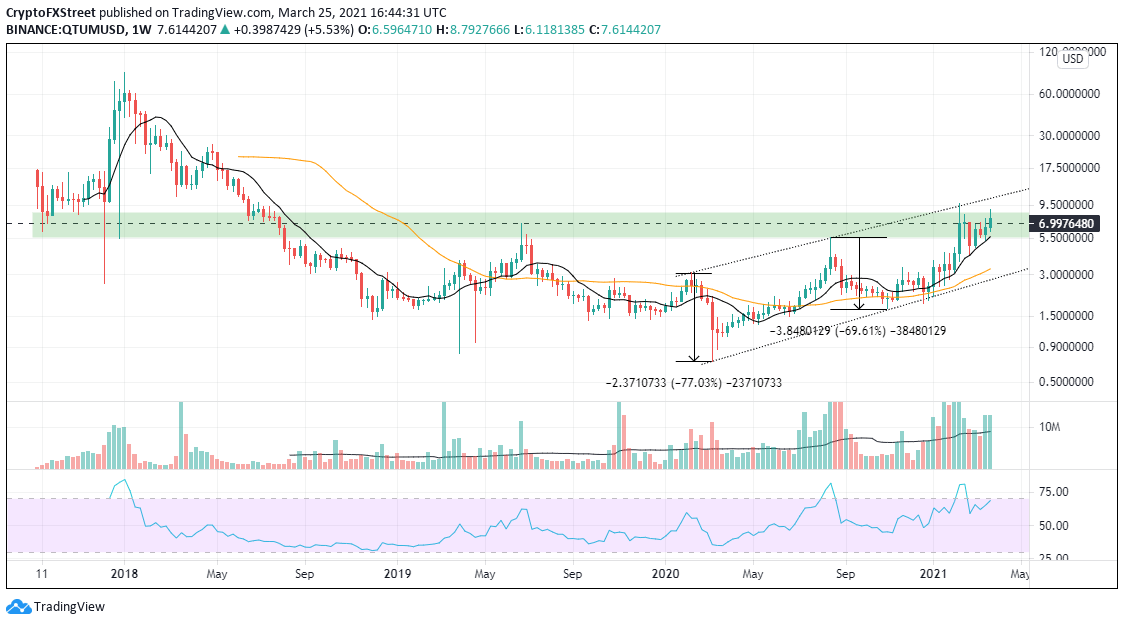
QTUM/USD weekly chart
Now, if the bulls overcome the distribution over $6.98 and can close QTUM firmly above the price level on a weekly basis, then the upside trendline might be in play at $10.64. Be alert to a potential negative RSI divergence with price if a new all-time high is achieved.
