- MATIC price struggling with resistance at the 21-day simple moving average (SMA).
- Volume contraction indicates price decline is corrective, not impulsive.
- Weekly Relative Strength Index (RSI) is still overbought.
MATIC price increase of 3000% from the beginning of 2021 reflects how Polygon brings tremendous scale to Ethereum using an adapted version of Plasma and PosS-based side chains. However, it was natural that the cryptocurrency corrected to the 0.50 retracement level of the 2021 mega-advance at $0.281. The total correction was on volume significantly less than the 50-day SMA.
MATIC price needs to reclaim critical moving average on a daily close
If Polygon can close above the 21-day SMA at $0.363, it would be the first step in confirming a correction low. The first notable resistance for a renewed rally is the 0.618 Fibonacci retracement level of the correction at $0.454, a gain of 18%, followed by the 0.786 Fibonacci retracement level at $0.498 and then the all-time high at $0.545.
It is important not to let a rise to $0.454 overshadow that Polygon is still very overbought on the weekly chart and needs more time to release the condition before confidently attacking new highs.
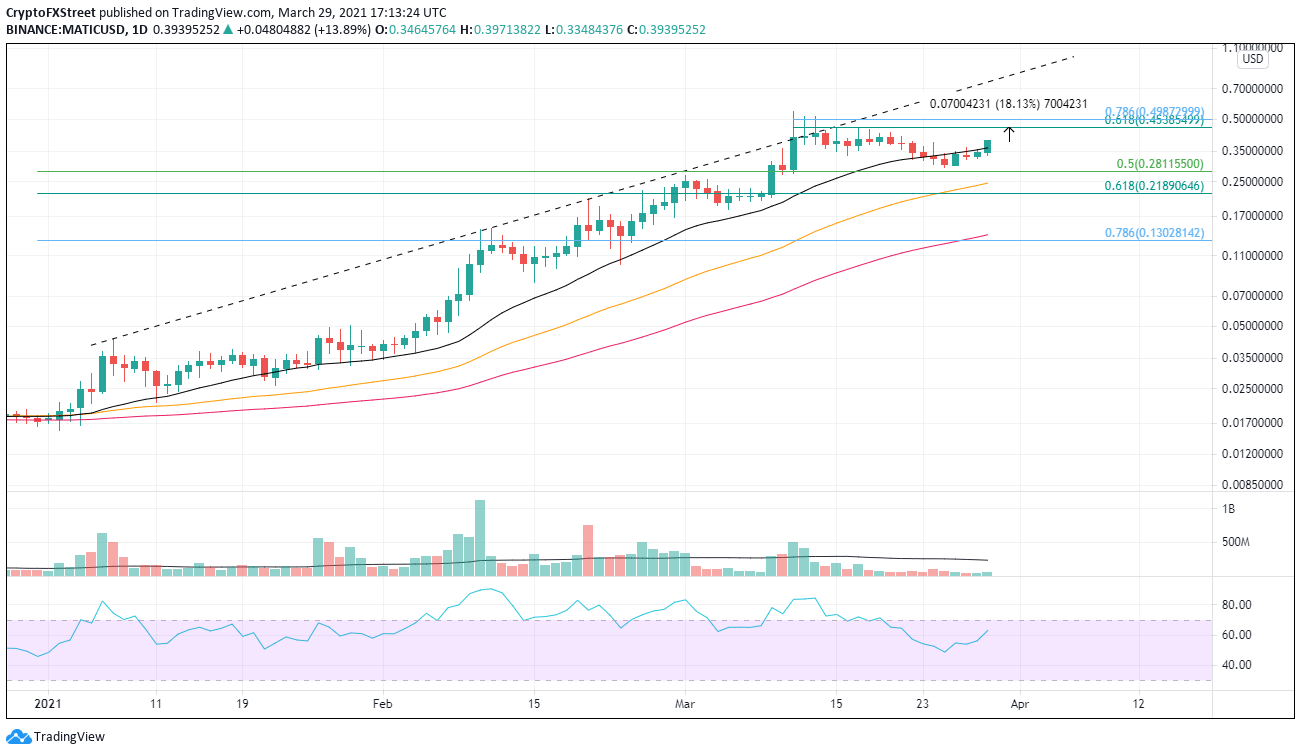
MATIC/USD daily chart
On the downside, MATIC price needs to hold the 0.50 retracement level at $0.281, or it will quickly test the 50-day SMA at $0.246 and then the 0.618 Fibonacci retracement level at $0.219.
