- Cardano price is bounded inside an ascending triangle pattern on the 12-hour chart.
- A breakout above $1.35 has a price target of $1.64, a new all-time high.
- ADA bears must hold a key resistance trend line to shift the odds back in their favor.
Cardano had a significant 10% breakout already in the past 48 hours and aims for more. The digital asset faces a robust resistance trend line on the 12-hour chart that has rejected the price several times in the past month.
Cardano price must climb above this barrier
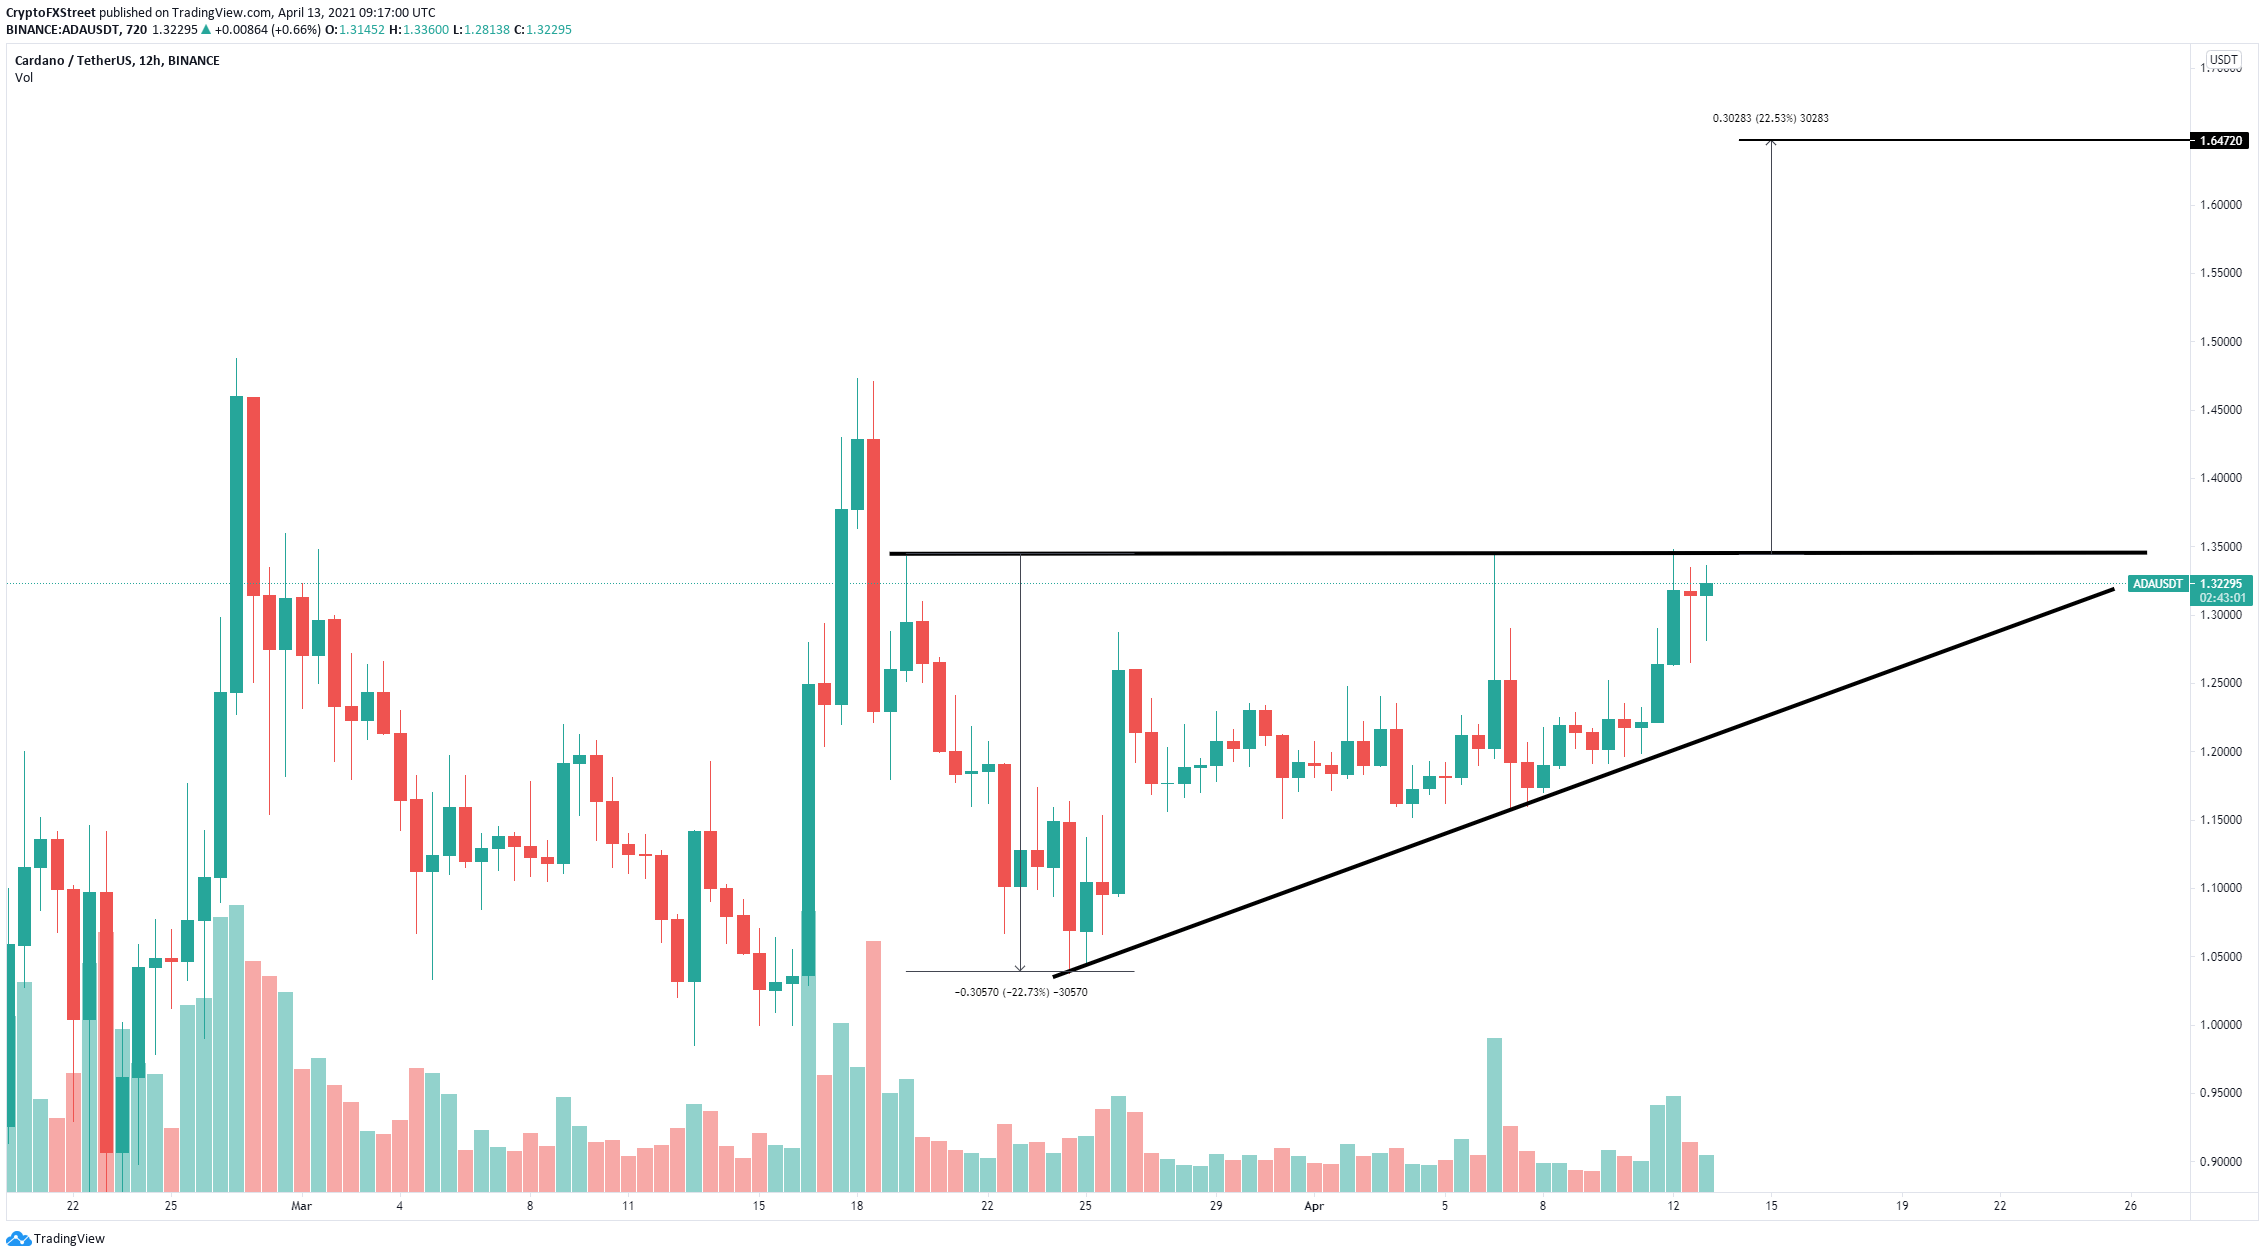
On the 12-hour chart, Cardano has formed an ascending triangle pattern drawn by connecting three highs with a parallel trend line and several higher lows with another trend line that touches the upper one.
ADA/USD 12-hour chart
The upper boundary at $1.35 is the critical barrier to crack for the bulls. ADA is trading at $1.317 at the time of writing, just 2% away from it. A breakout above this key point has a price target of $1.647, calculated by measuring the distance between the top trend line to the beginning of the lower one.
However, there is another crucial resistance level at around $1.47 that has rejected Cardano price two times in the past month. This would be the first price target before new all-time highs.
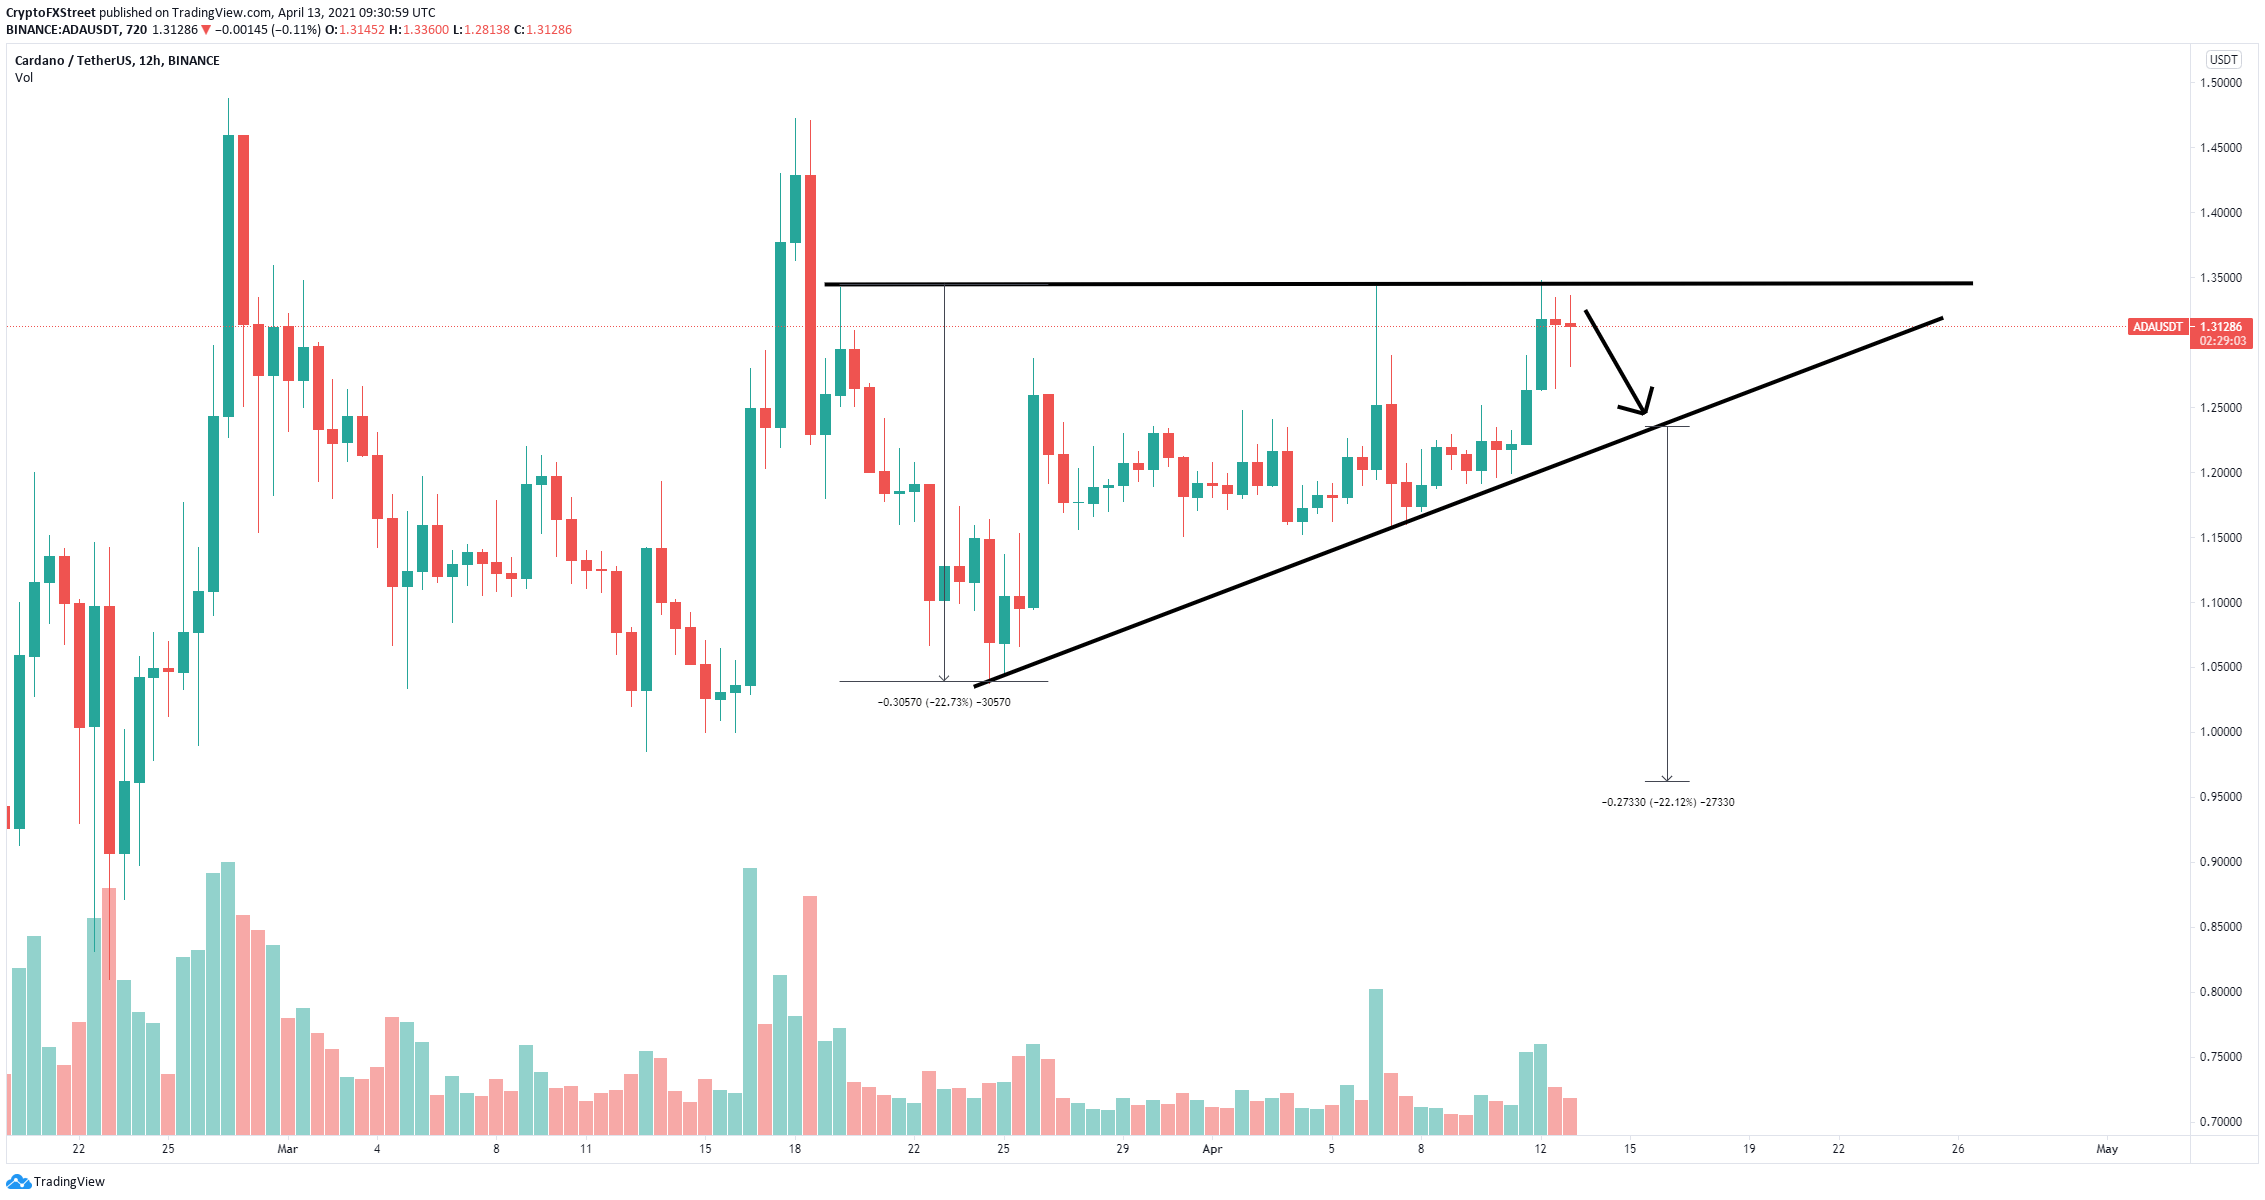
ADA/USD 12-hour chart
To invalidate the bullish outlook, ADA bears must hold $1.35 at all costs. A strong rejection from this level should push Cardano price down to $1.24, the lower trend line of the pattern. A breakdown below this point also has a 22% target move down to $0.96. Before that, there are two targets at $1.15 and $1.04.


