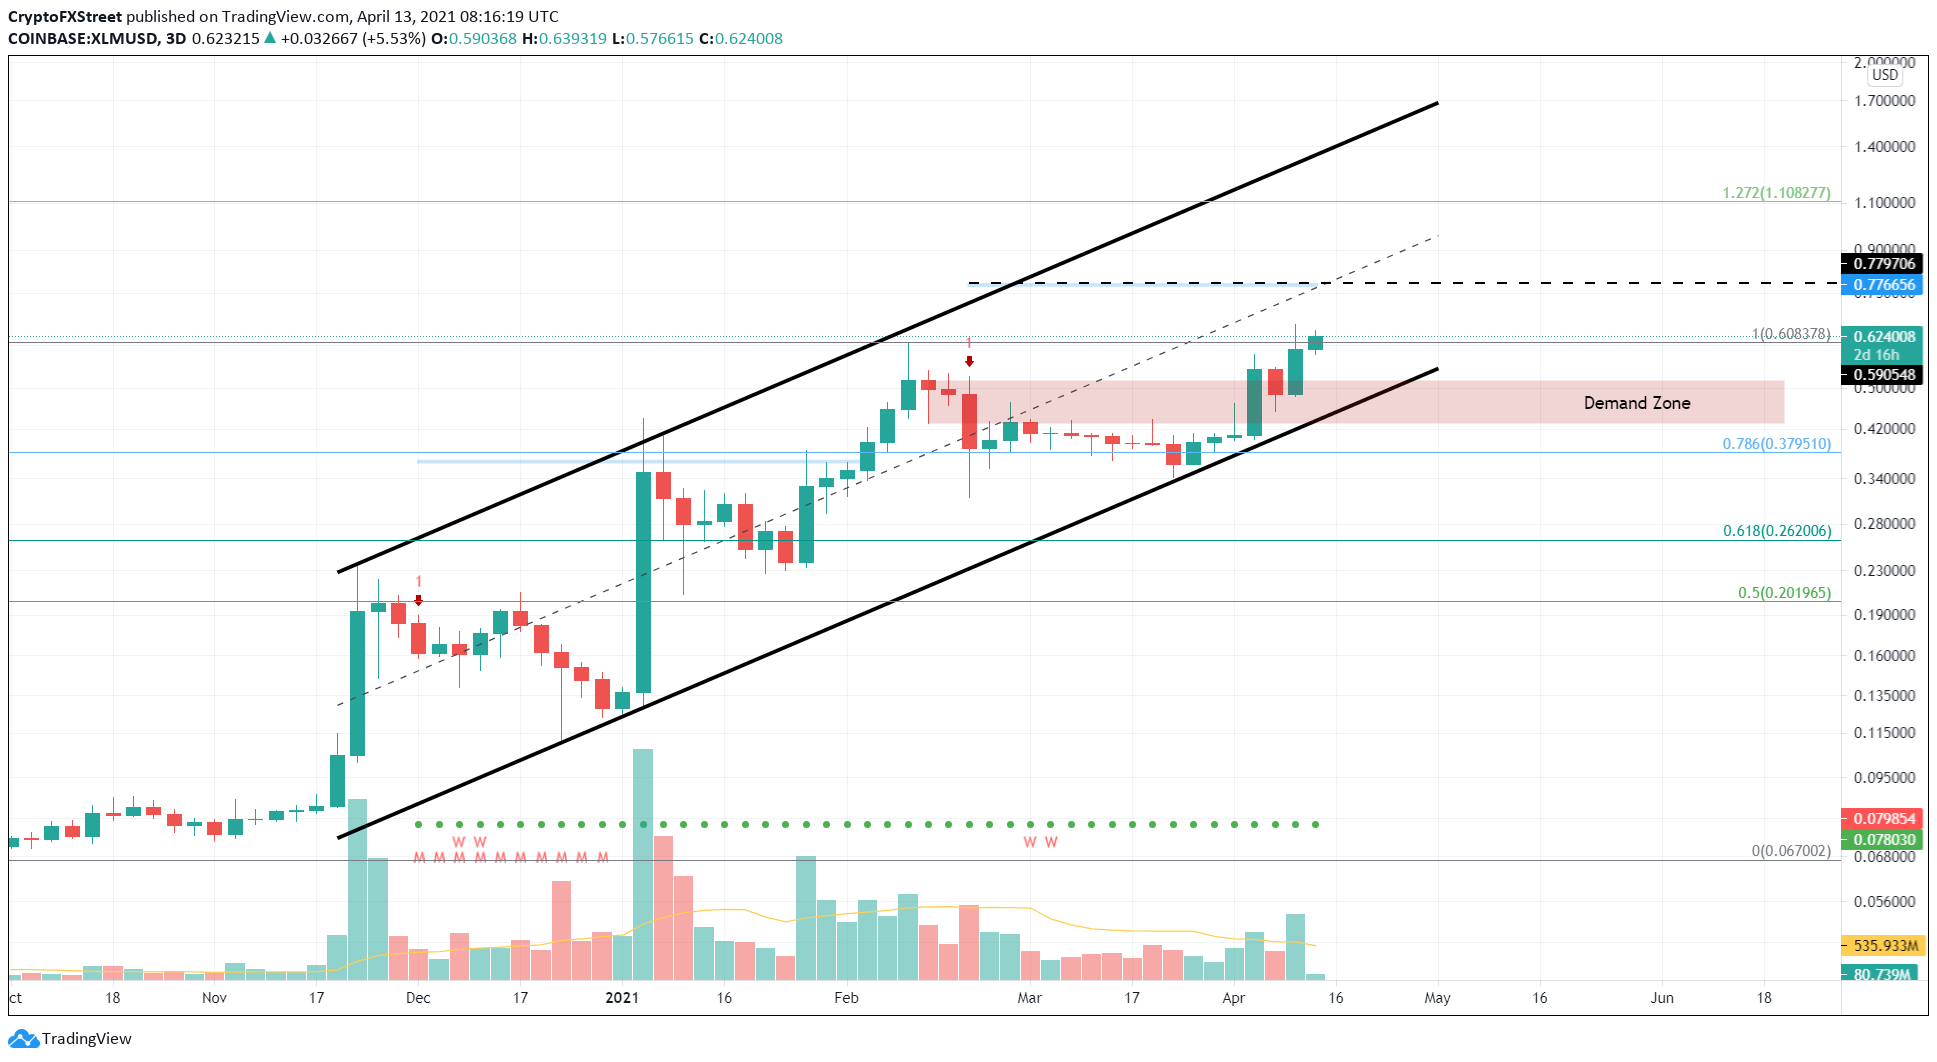
- XLM price has surged nearly 90% after bouncing off the ascending parallel channel’s lower boundary.
- The recent upswing has generated a new yearly high at $0.656 after toppling the old one at $0.608.
- A 23% climb could see Stellar tap the demand barrier at $0.779, coinciding with the setup’s middle line.
XLM price has seen a massive run-up over the last couple of weeks that could extend a little higher.
XLM price eyes more gains
XLM price traverses an ascending parallel channel obtained by connecting two higher highs and three higher lows using trend lines. After generating the recent swing low at $0.342, Stellar has soared nearly 90% to $0.656.
The Momentum Reversal Indicator’s breakout line at $0.776 is the only significant supply barrier on the 3-day chart. Hence, if the buying pressure continues to dominate, XLM price could quickly rise 23% to the said level.
Interestingly, the setup’s middle line coincides with $0.776, making it a considerably strong level to surpass. Therefore, the bulls might face extinction here and trigger a downtrend.
While the extension of this rally seems plausible, XLM price could first see a pullback toward the lower trend line at $0.487, followed by a move higher to the intended target.
The 127.2% Fibonacci extension at $1.10 will be the next area of interest for buyers.
XLM/USDT 3-day chart
Regardless of the bullish outlook, if the sellers overwhelm the buyers, XLM price could enter the demand zone that ranges from $0.516 to $0.430. A breakdown of the lower range will put an end to the remittance token’s bullish thesis.
In such a scenario, XLM could retrace 11% to the 78.6% Fibonacci retracement level at $0.379.

