- Pancake Swap gained about $3.6 billion in market capitalization since the beginning of 2021.
- Terra had an even stronger rally, increasing its market capitalization by $5.85 billion.
- Both cryptocurrencies have profited from the massive gas fees on the Ethereum network.
In 2021, Ethereum price exploded from a low of $700 to a current all-time high at $2,400. However, this rally also made the gas fees on the Ethereum blockchain explode. Users were forced to pay $15-20 per normal ETH transaction and up to $200 for interactions with smart contracts.
With such a large increase in gas fees, cryptocurrency investors started to look for alternatives. AlthoughCardano and Polkadot blockchains have a lot of potential, they do not have smart contracts just yet. On the other hand, the Binance Smart Chain and Terra do.
Pancake Swap price needs to hold key level to see another leg up
BNB price exploded to a new all-time high above $600 reaching a market capitalization of $90 billion reaching 3rd amongst Bitcoin and Ethereum. Pancake Swap is the Uniswap of the BSC chain and, also had a significant rally alongside BNB.
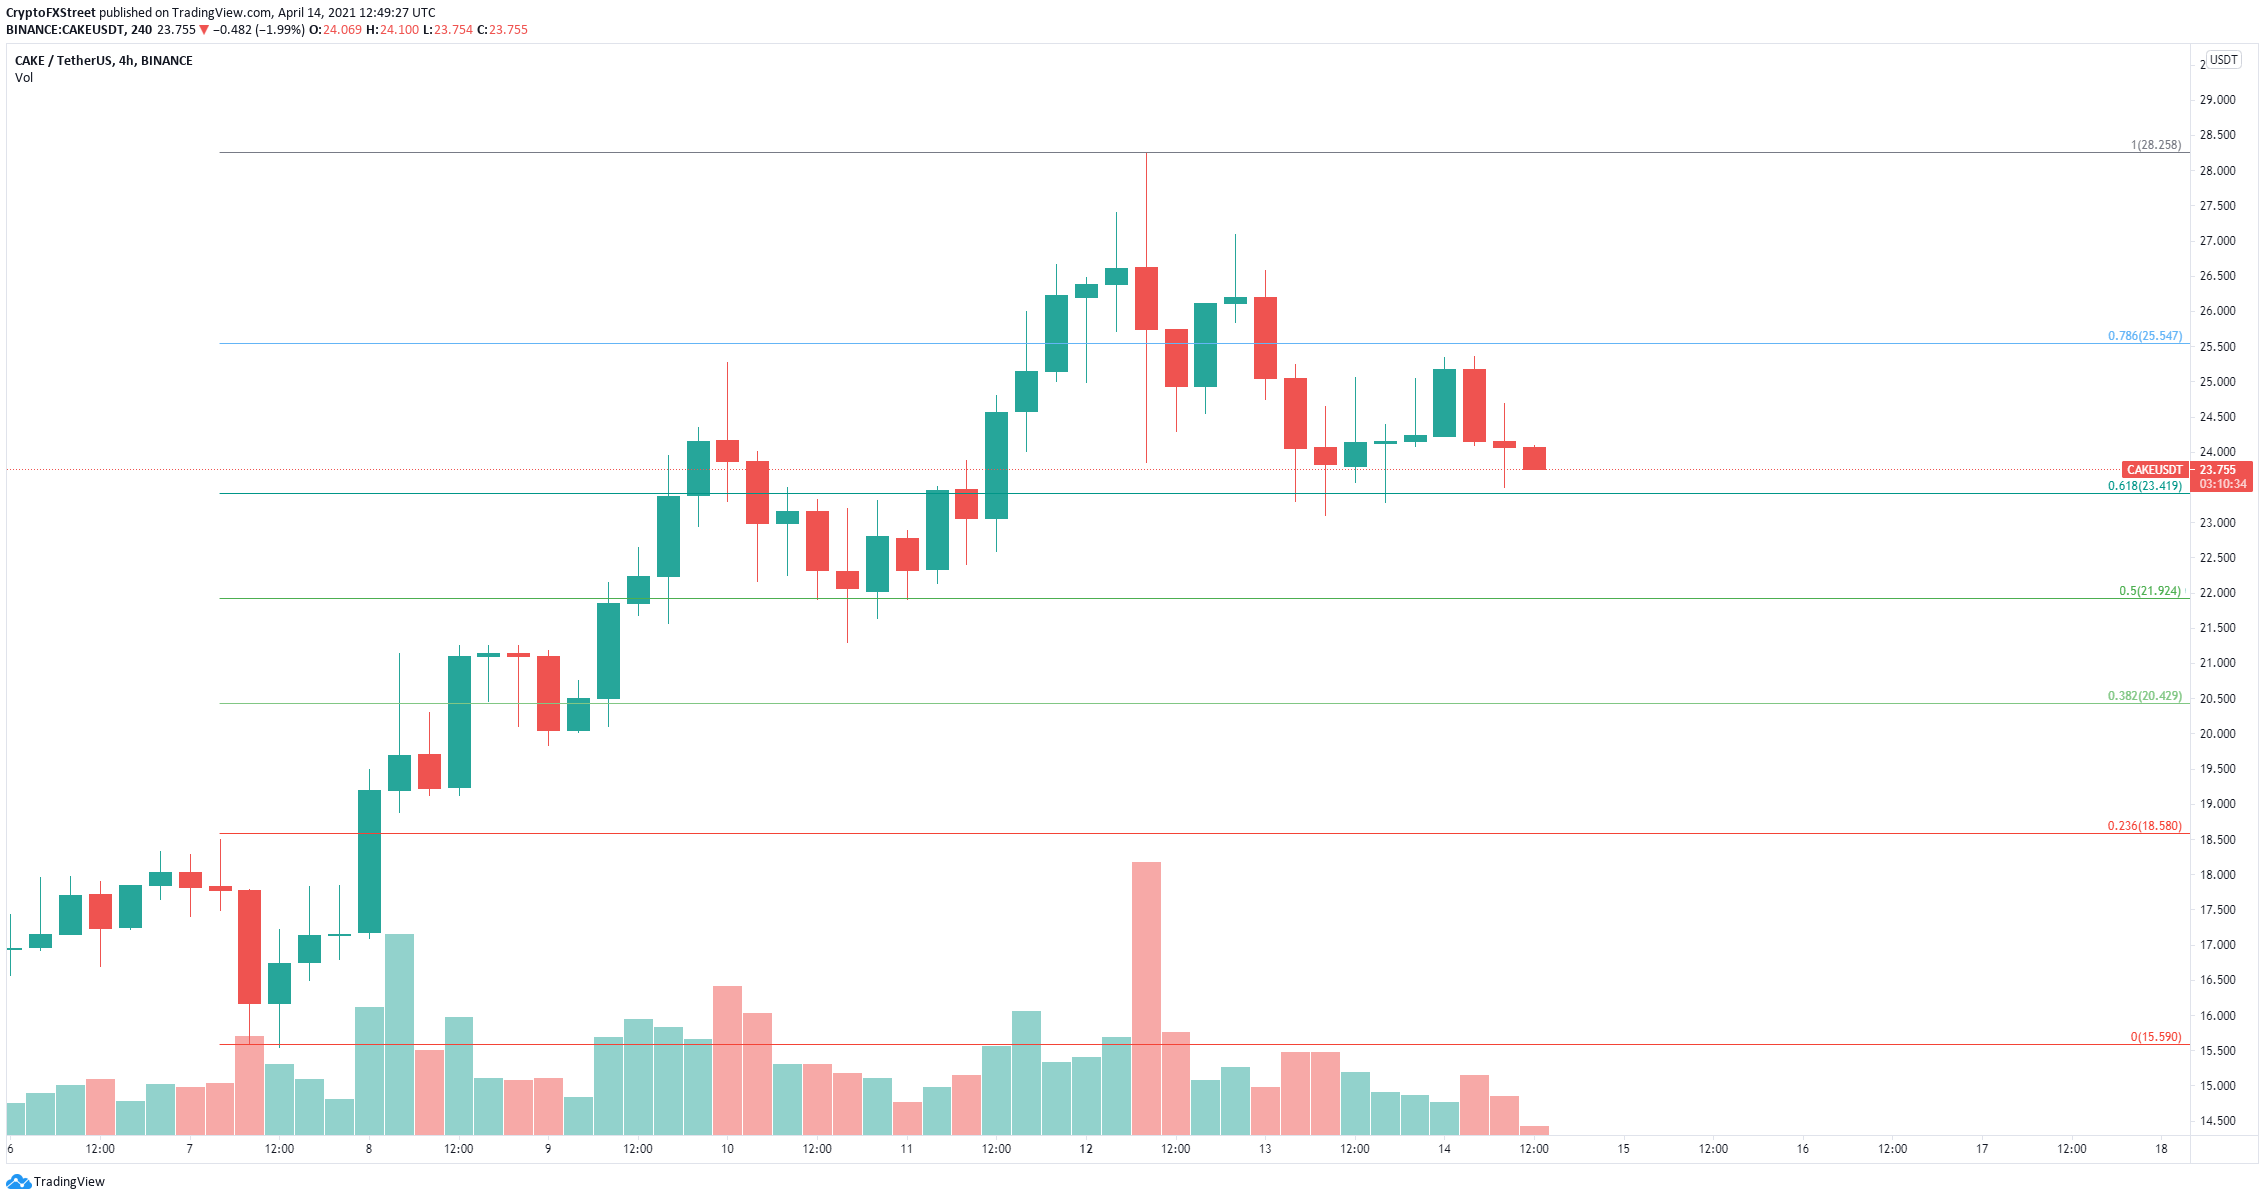
CAKE/USD 4-hour chart
After an 80% rally since April 7, CAKE has been under consolidation but managed to hold the 61.8% Fibonacci retracement level, a critical support point in the short-term. A rebound from this level should drive CAKE price towards the 78.6% Fibonacci level.
Pancake Swap plans to release the second version of its platform in the second quarter of this year introducing Binary Options, lending and borrowing, and many other improvements to the exchange.
CAKE Sell Signals
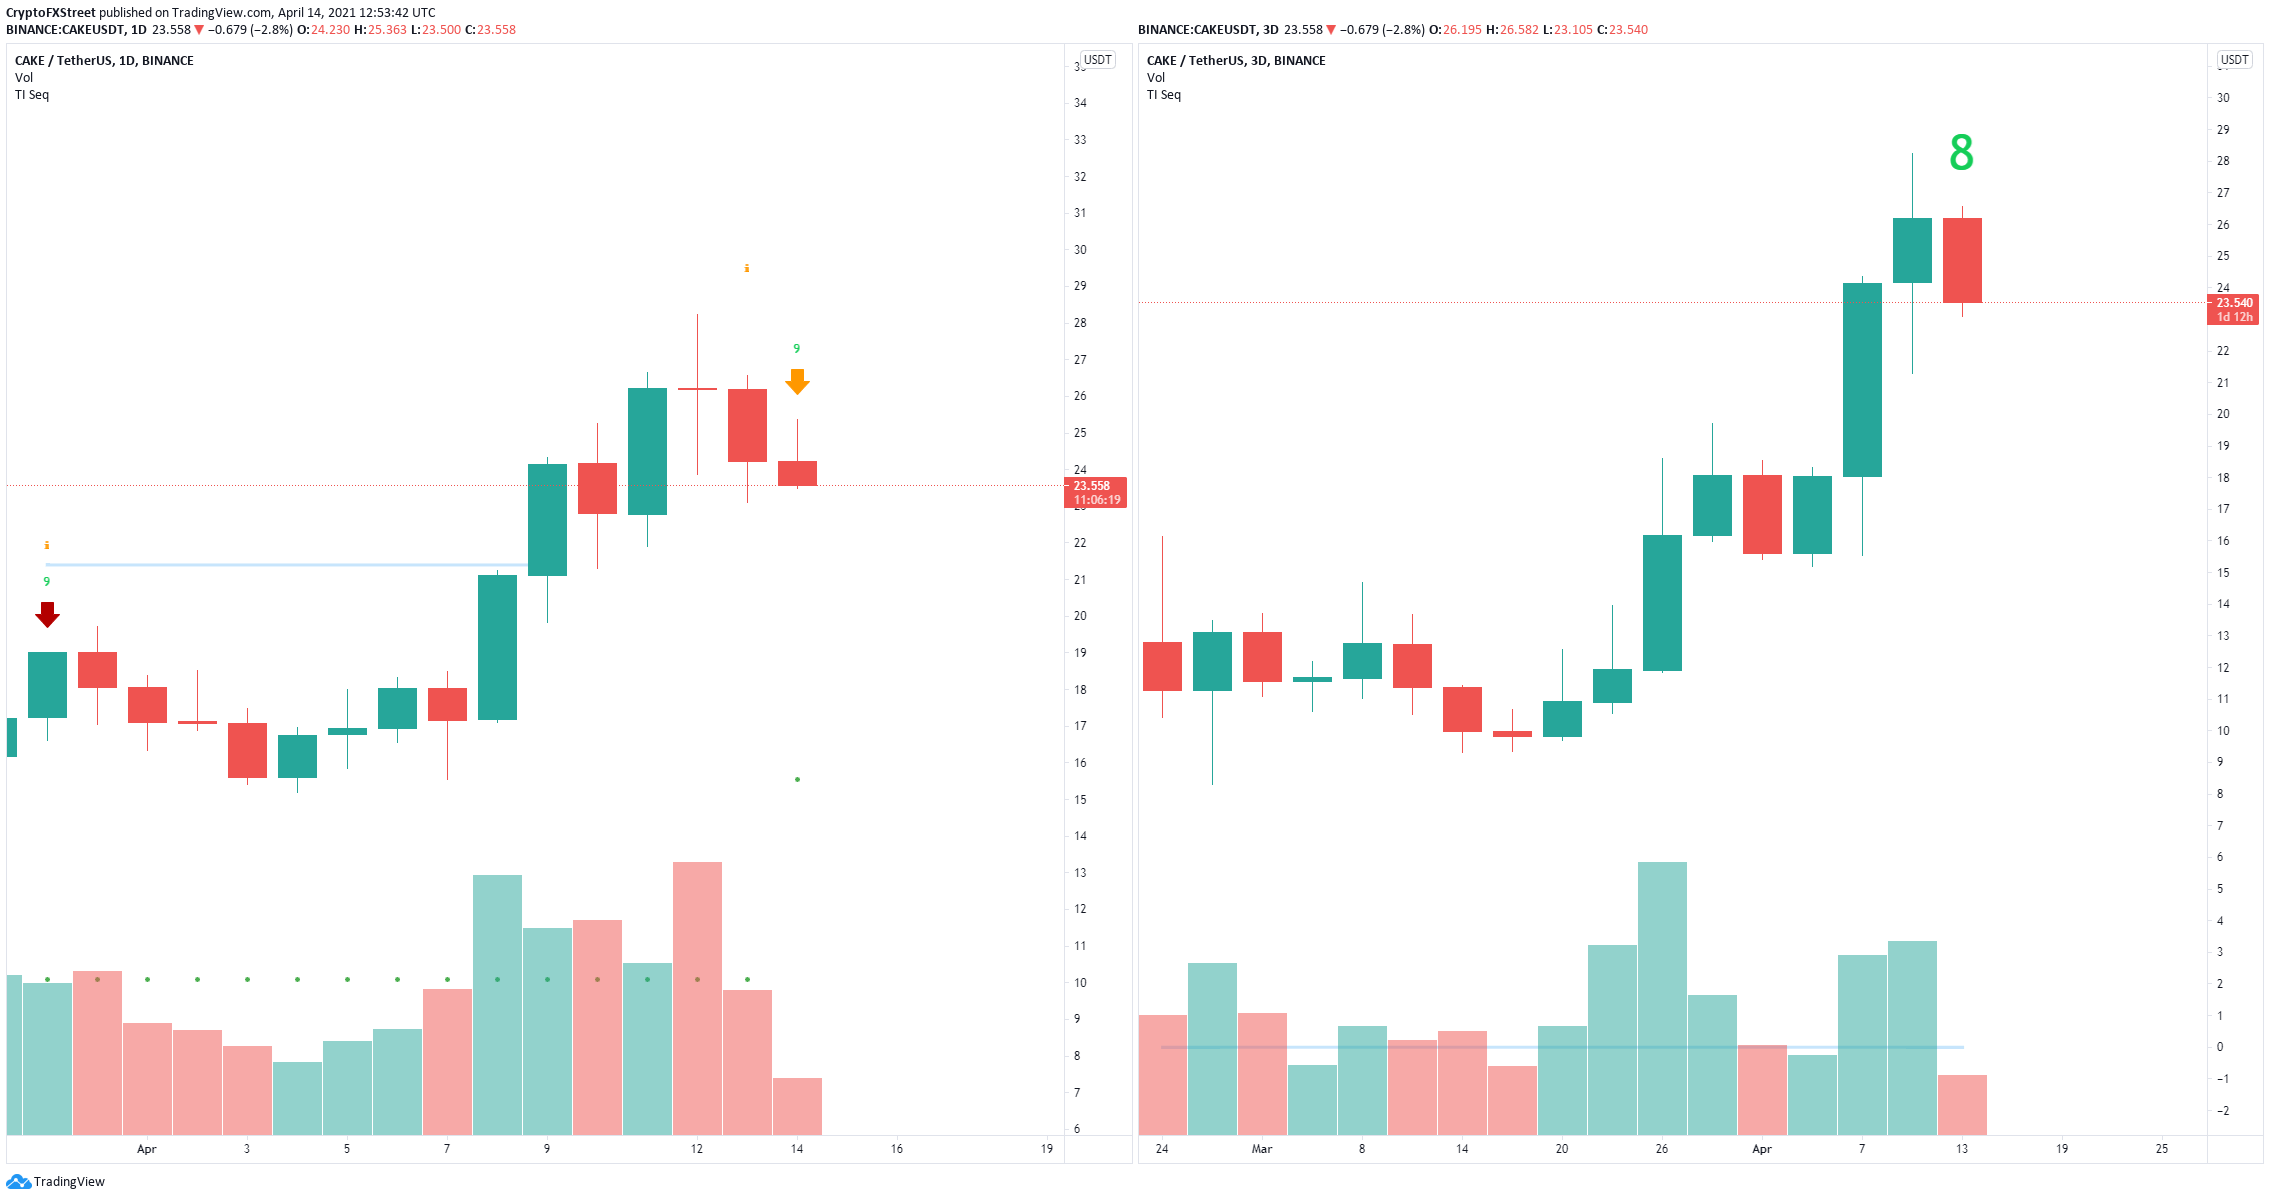
However, there seems to be significant selling pressure as the TD Sequential indicator has presented a sell signal on the daily chart and a green ‘8’ candlestick on the 3-day chart, which is usually followed by another sell signal.
After such a massive rally, it’s not surprising to see CAKE in need of a correction. A breakdown below the 61.8% Fibonacci retracement level at $23.4 will quickly drive CAKE price toward $21.92 at the 50% Fib level.
Terra price must climb above this level to see a 30% breakout
Terra Money is a blockchain similar to Ethereum with faster and fewer fee costs. Of course, investors quickly noticed and started to accumulate the digital asset LUNA to capitalize on its advantages.
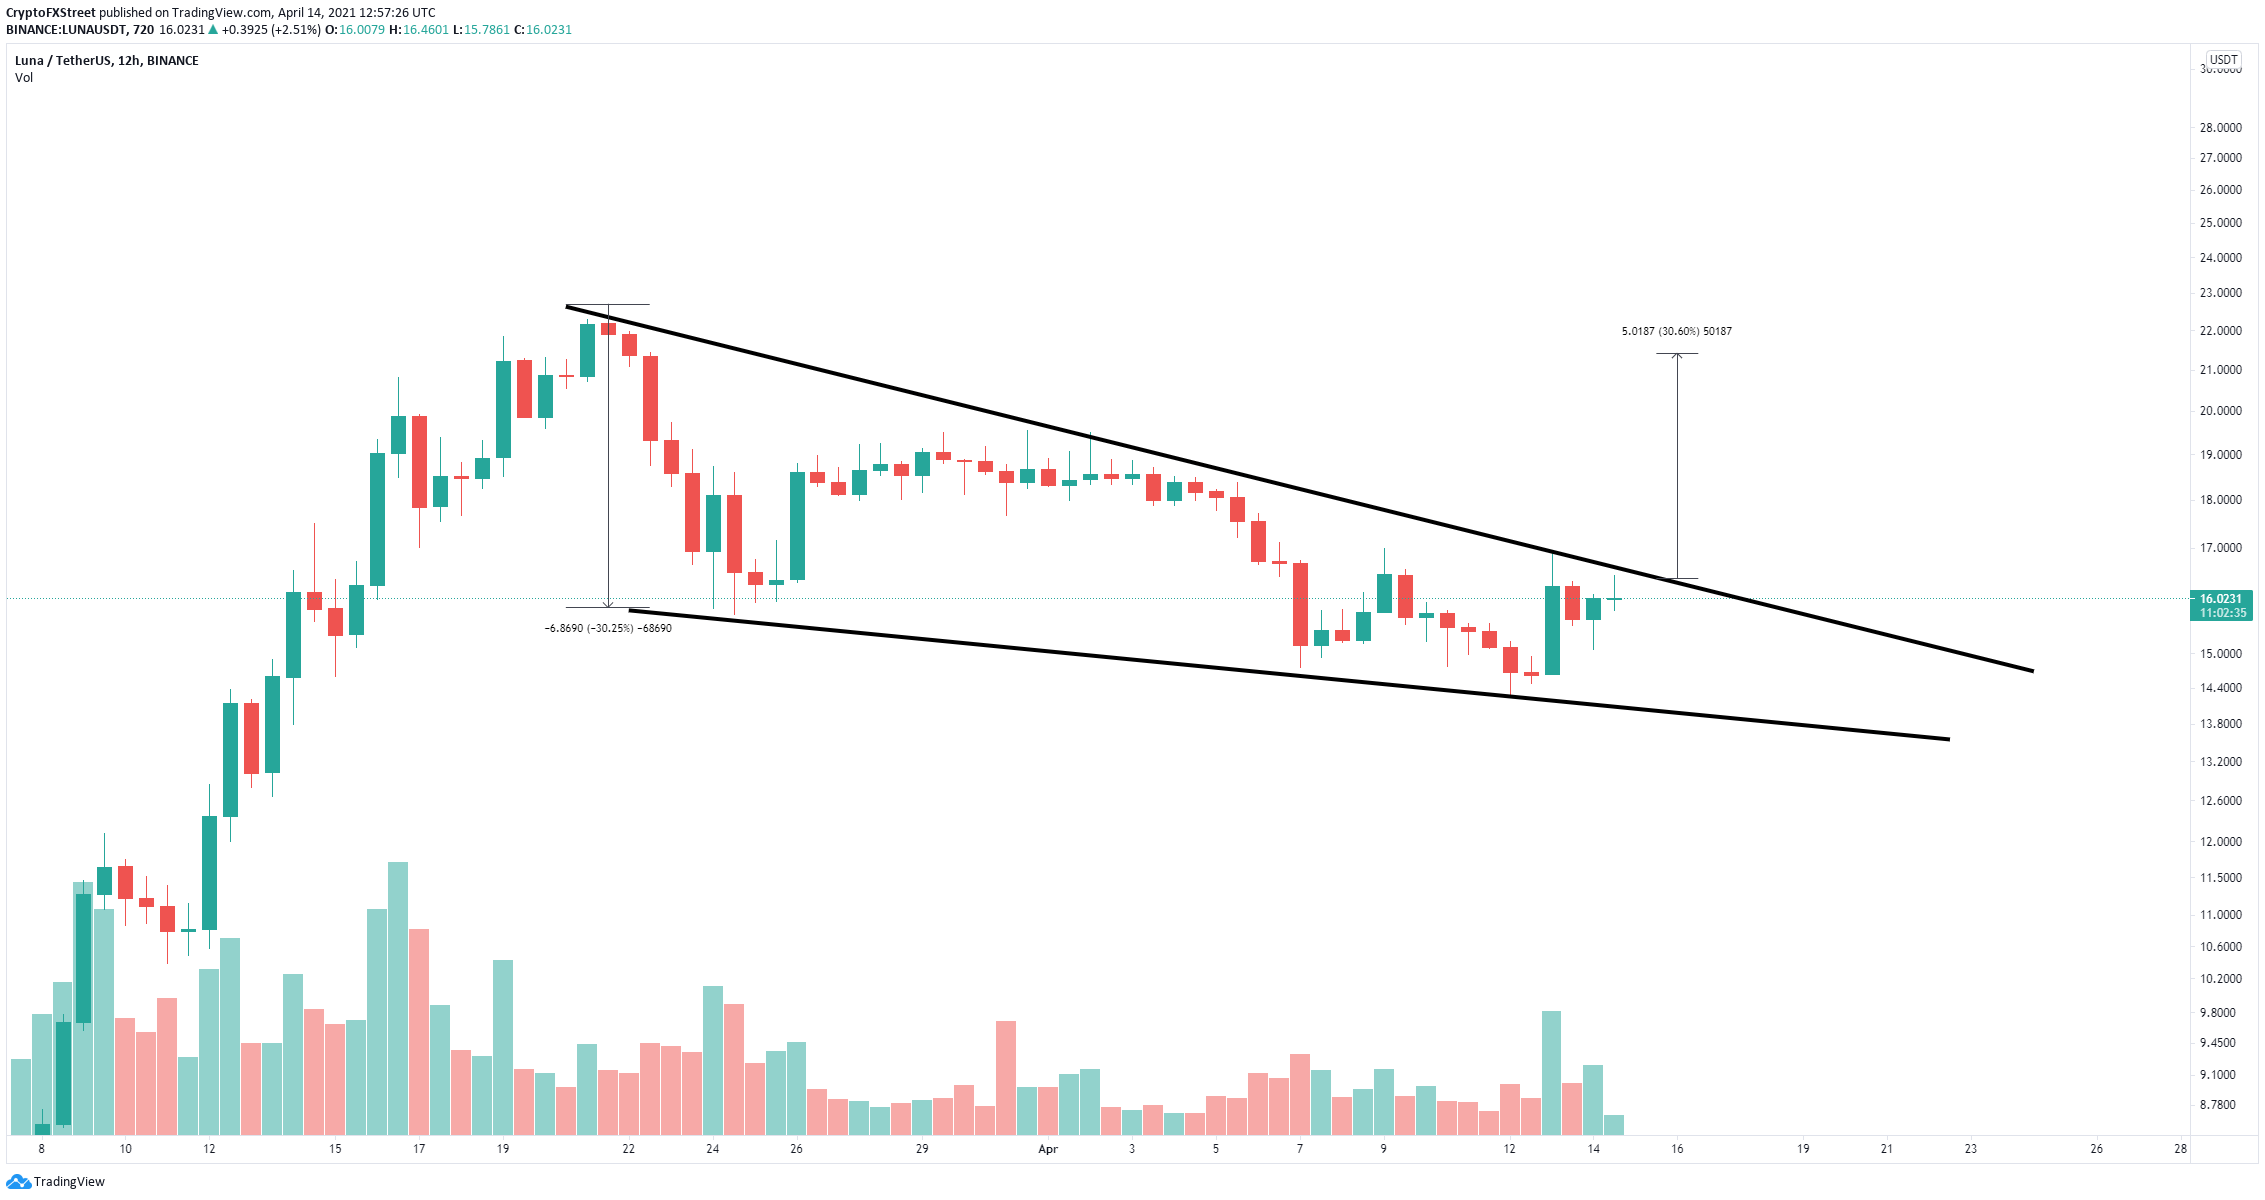
LUNA/USD 12-hour chart
On the 12-hour chart, LUNA has formed a descending wedge pattern drawn by connecting the lower highs and lower lows with two trendlines that converge. The key resistance level is located at $16.4.
A breakout above this point should drive Terra price toward $19.5 initially and as high as $21.4 in the longer term. On the other hand, if the bears can hold the upper boundary resistance level, LUNA will fall to the lower trendline established at $14.


