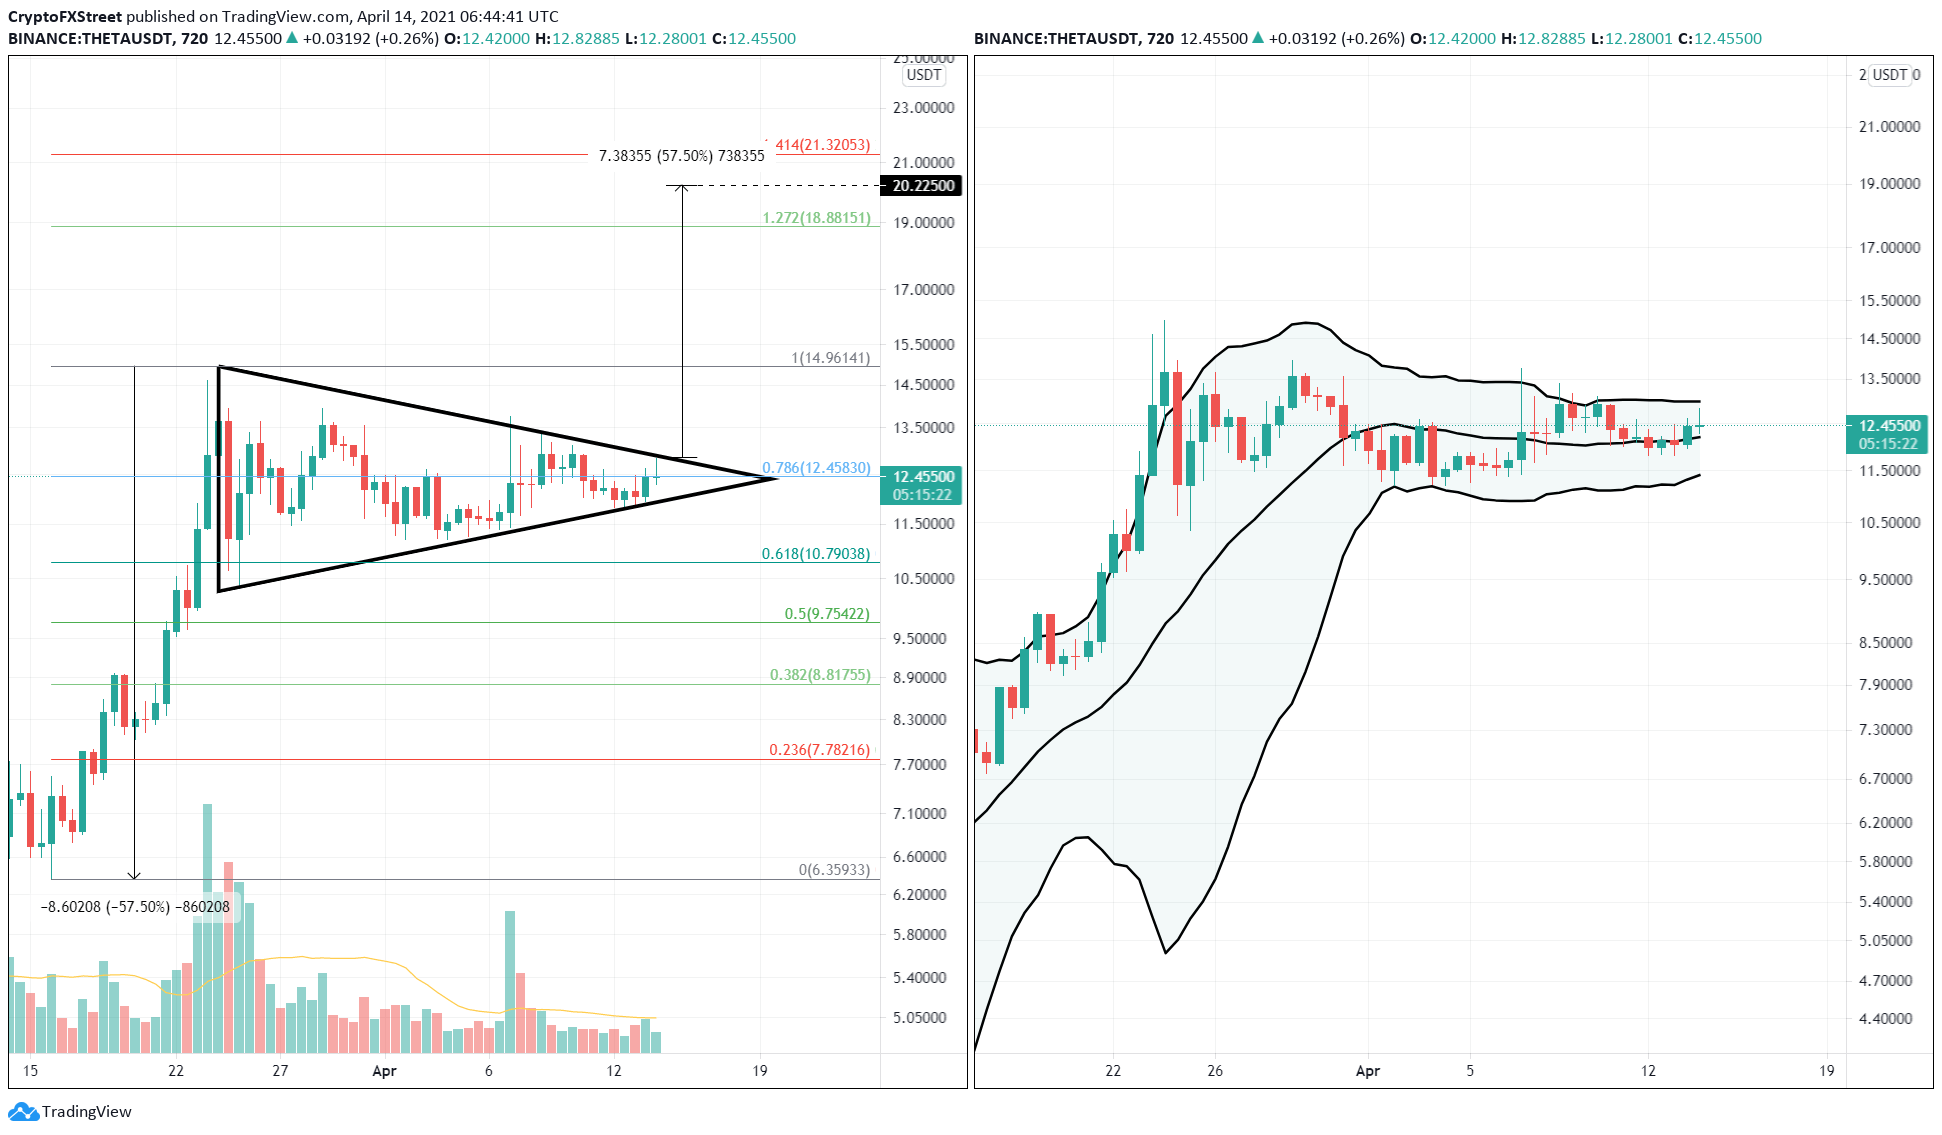
- Theta price shows the formation of a bullish pennant that forecasts a 57% upswing to $20.22.
- A decisive candlestick close above the pennant formation at $12.84 signals the start of this rally.
- The Bollinger Bands indicator forecasts a volatile move after a prolonged squeeze.
Theta price shows a clear bullish bias as it nears the end of its consolidation, hinting at massive gains in the near future.
Theta price primed for breakout
Theta price is consolidating in a bullish pennant formed due to a significant spike in price followed by a consolidation in the form of a pennant. A breach of the upper trend line of the pattern signals a breakout and forecasts a 57% upswing, determined by measuring the flag pole’s height.
Adding this measure to the breakout point at $12.84 yields a target of $20.22.
The Bollinger Bands indicator shows that Theta price is enveloped tightly by the upper and the lower band, suggesting a lack of volatility. Hence, the move that follows this consolidation will result in a sharp move. While this technical indicator does not reveal a direction, the bullish pennant formation suggests that this volatile move will most likely head higher.
Essential levels to keep an eye out for include the 127.2% and the 141.4% Fibonacci extension levels at $17.30 and $18.52. Interestingly, the target is near the 161.8% Fibonacci extension at $20.27, adding credence to this target.
THETA/USDT 12-hour chart
Regardless of the bullish outlook, a breakdown of the pennant’s lower boundary could spell trouble for Theta. If the 50% Fibonacci retracement level at $10.66 is breached, it would create a lower low and signal a bearish breakout.
A persistence of selling pressure could drag THETA as low as $9.64.

