- The digital asset is trading just above a critical support level that must be held.
- In the long term, Stellar bulls still have the upper hand, as XLM remains in a huge uptrend.
- A bear flag on the 1-hour chart could pose some problems for Stellar in the short term
Stellar has enjoyed an amazing rally since the beginning of 2021 and hit an all-time high at $0.69 on April 14. The digital asset must hold a crucial support level to continue with the uptrend and reach new highs.
XLM price must defend this significant trendline to see a new leg up
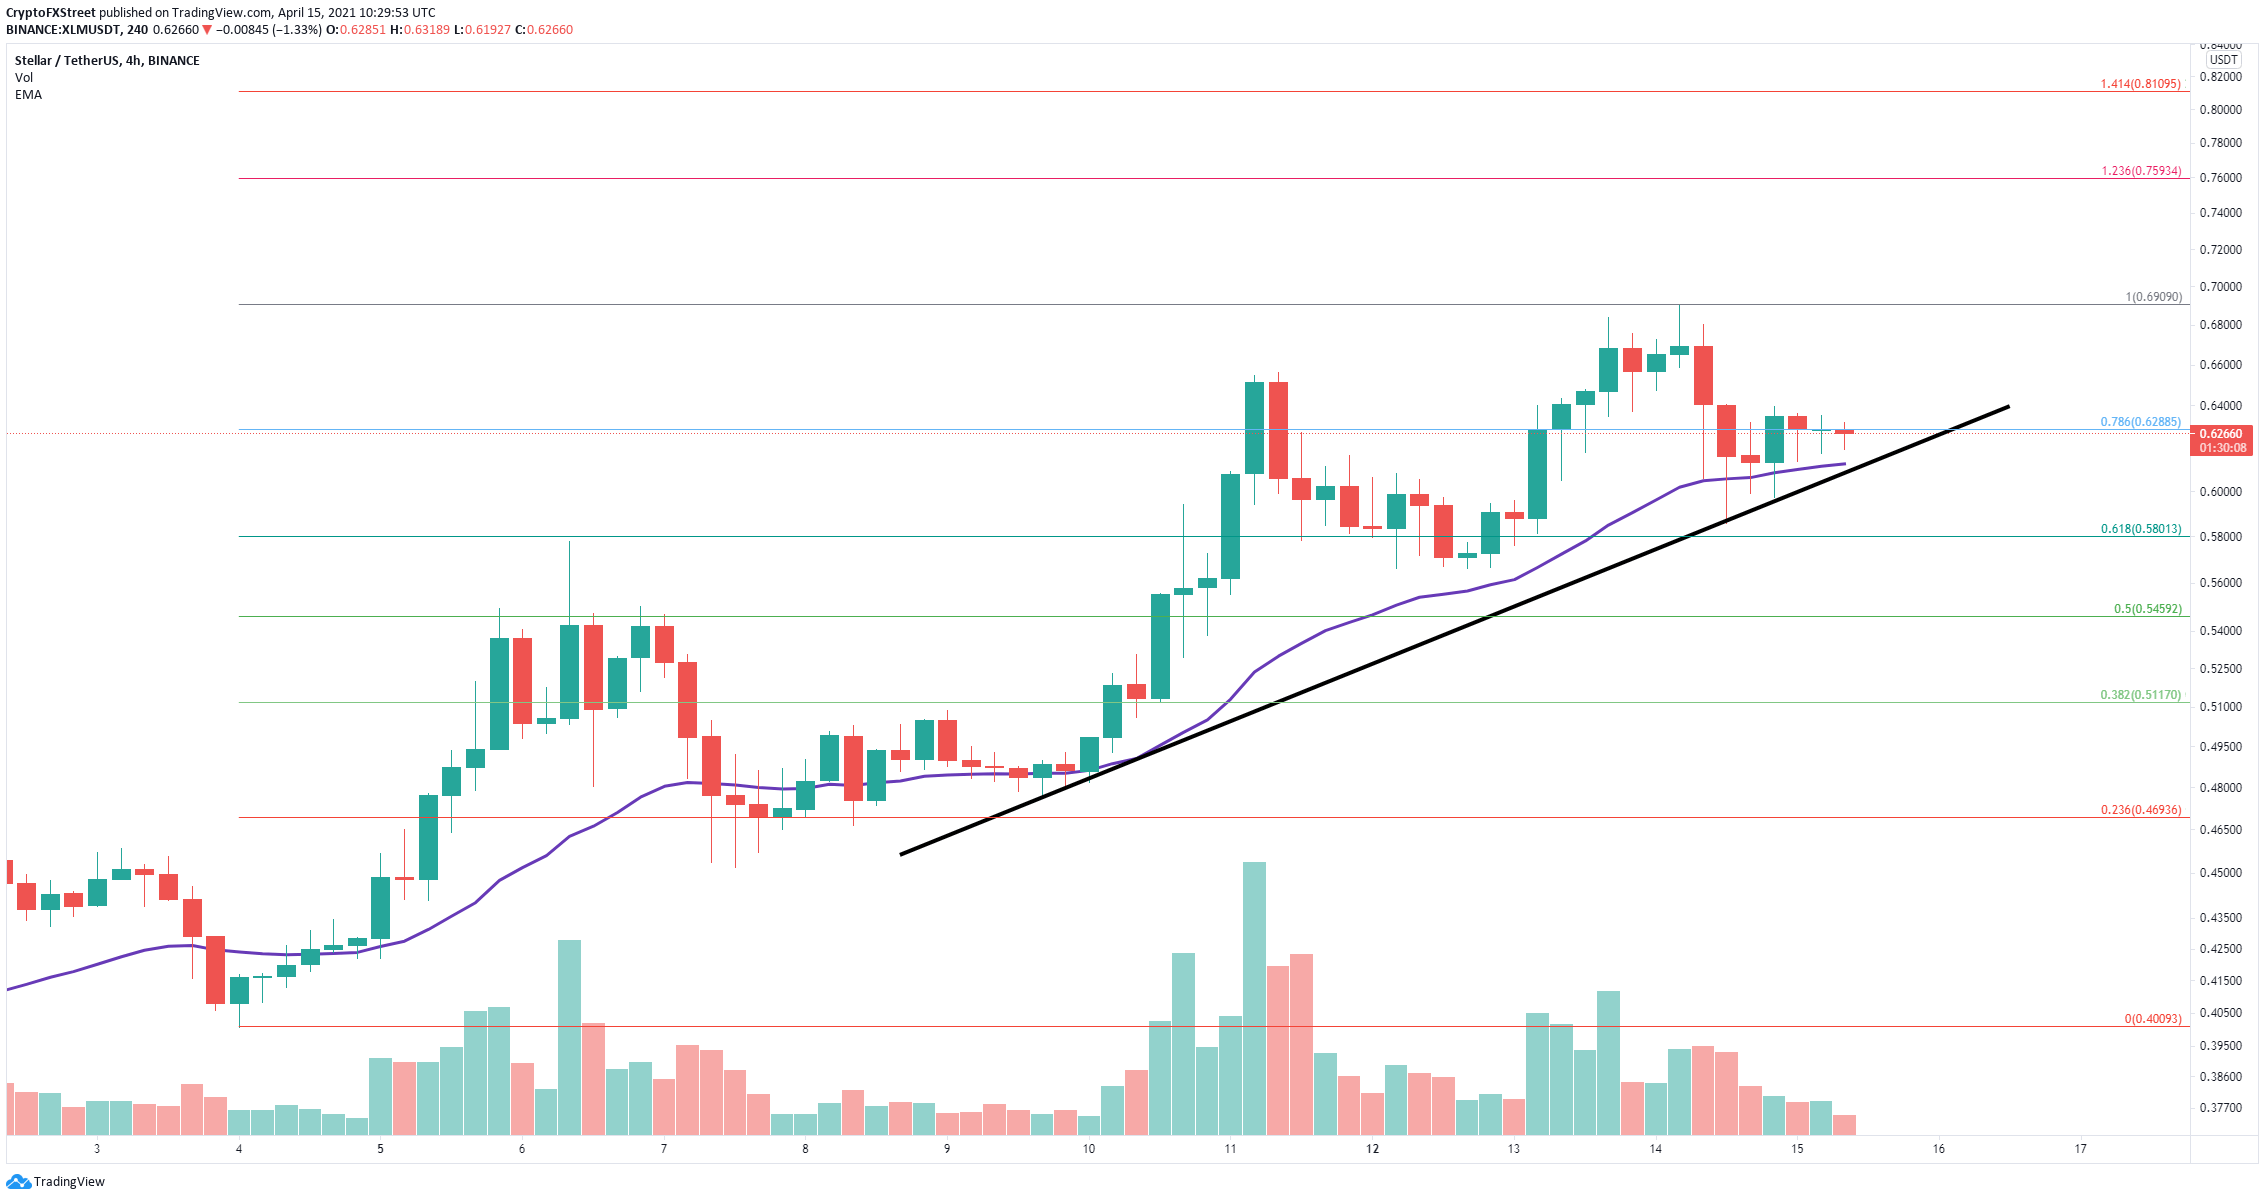
XLM is trading at $0.625 at the time of writing, right above the 25 four-hour EMA, and a trendline formed since April 9. Both converge at $0.61, which is the critical point that bulls must hold.
XLM/USD 4-hour chart
A rebound from this crucial support should drive XLM price up to its previous high of $0.69. A breakout above this point will push Stellar toward the 123.6% Fibonacci level at $0.759 and even as high as $0.81 in the longer term.
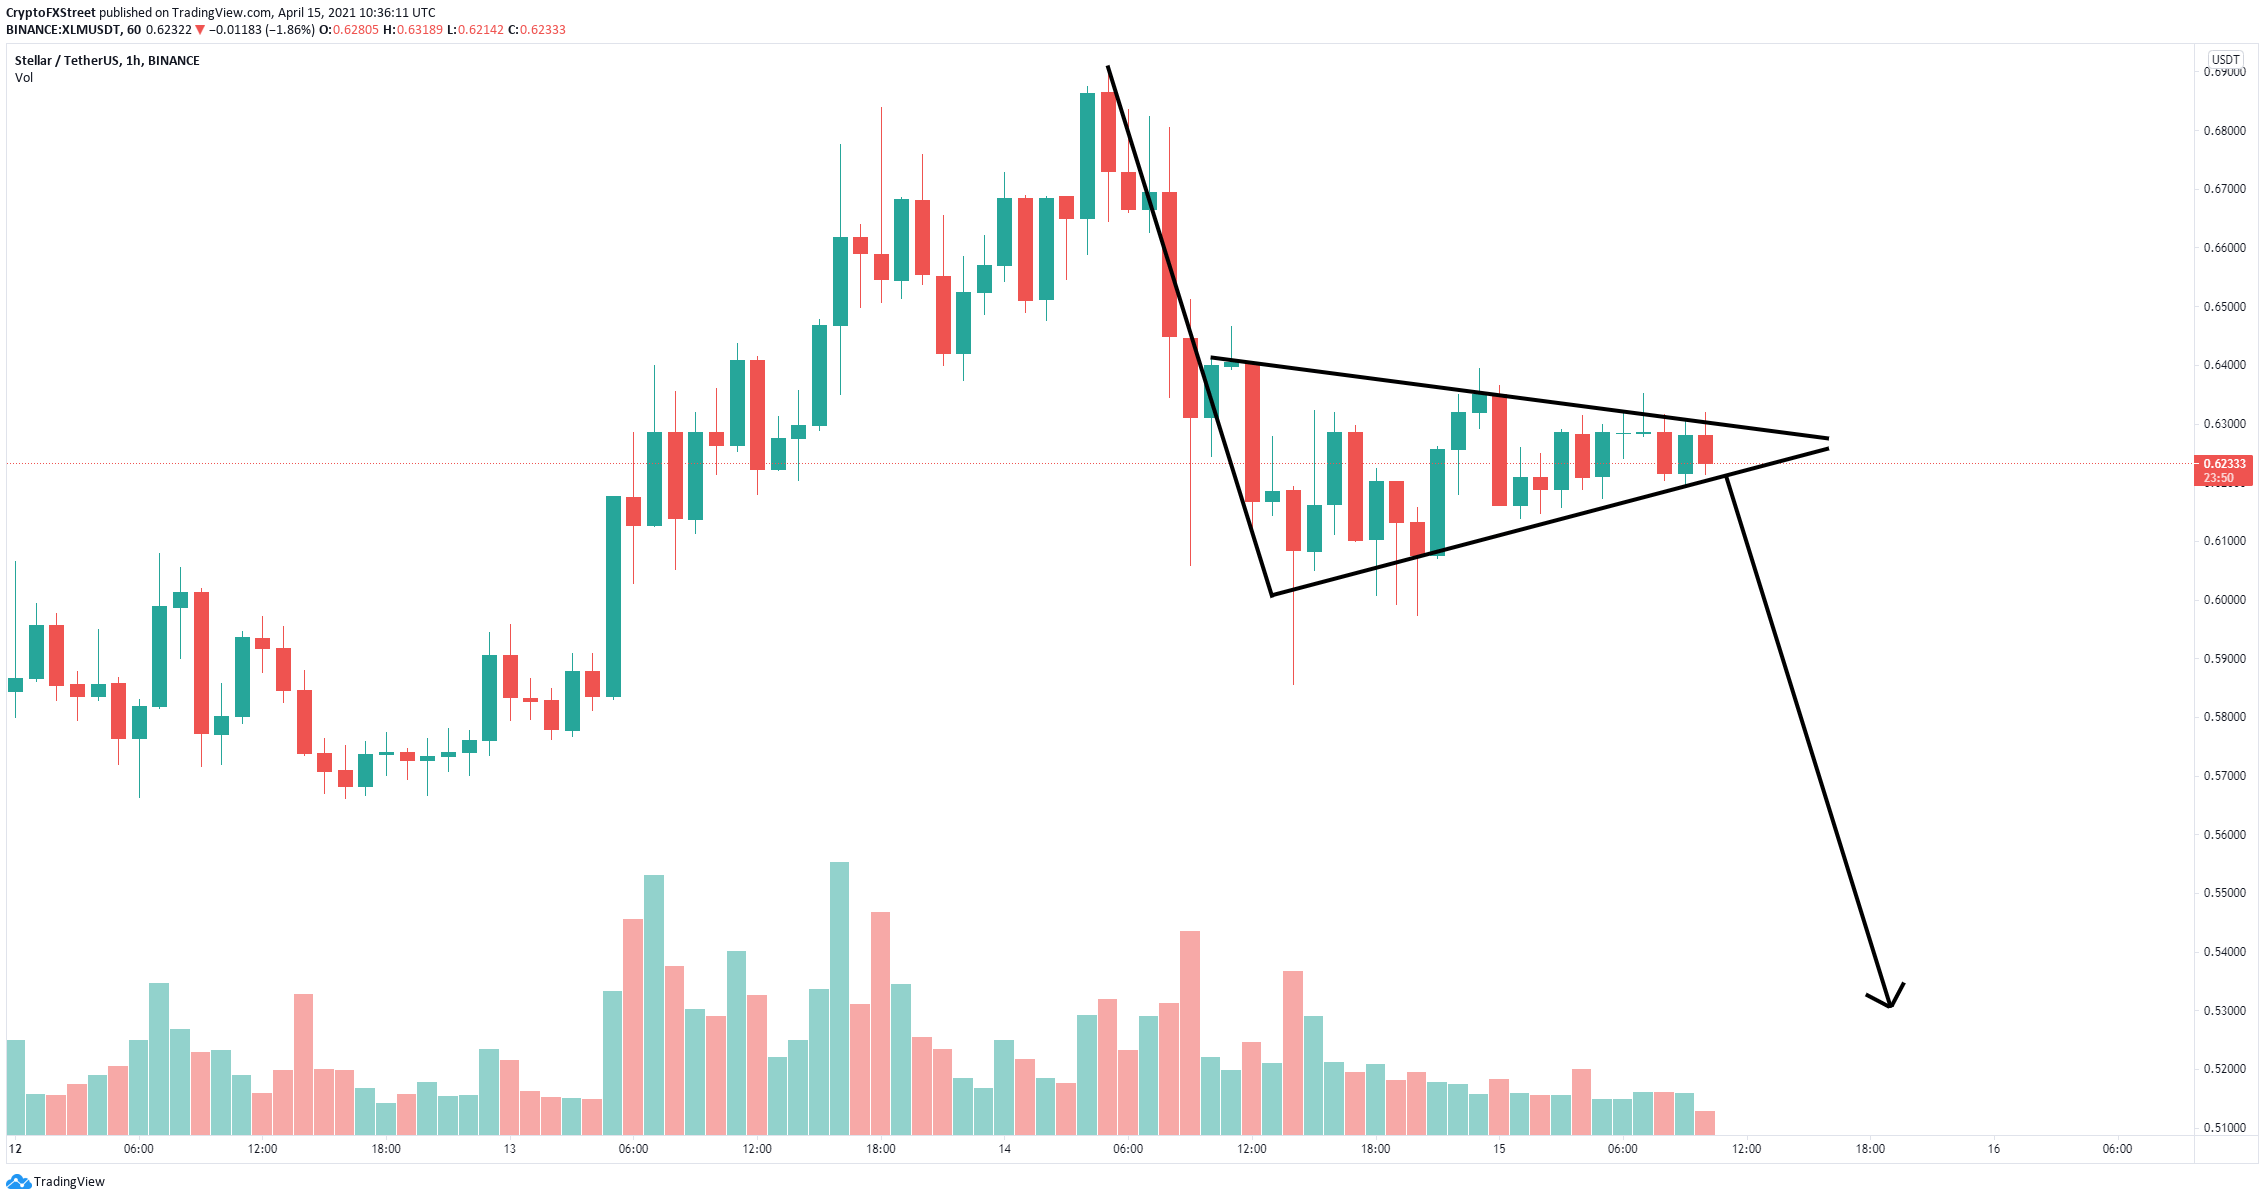
XLM/USD 1-hour chart
However, losing this critical level would also validate a bear flag formed on the 1-hour chart. A breakdown of this flag has a price target of $0.53, but XLM bears have other targets before that at $0.58, a low established on April 14 and $0.56, formed on April 12. The lack of trading volume in the past 24 hours indicates that XLM is on the verge of a significant move.


