- Zilliqa price is trading inside an ascending parallel channel on the daily chart.
- The digital asset must hold a crucial support level to avoid a massive fall.
- ZIL momentum has shifted in favor of the bears in the past three days.
Zilliqa has lost 30% of its market capitalization in the past three days. The digital asset must hold a critical support level to avoid further downside action.
Zilliqa price could be on the brink of another 30% fall
Zilliqa has formed an ascending parallel channel on the daily chart that can be drawn connecting the higher highs and lower highs with two parallel trendlines.
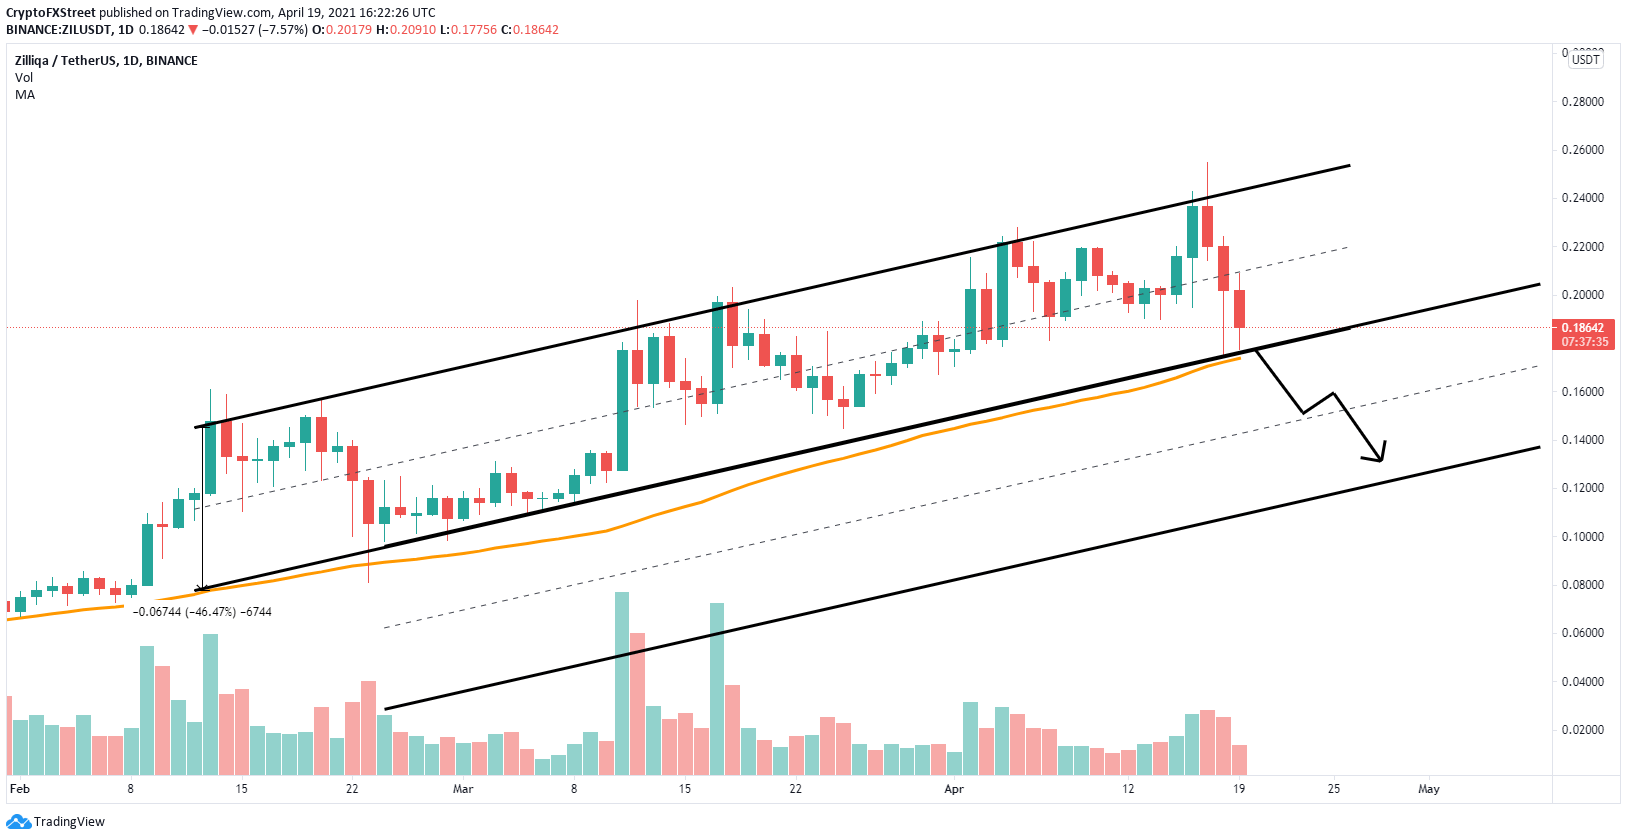
ZIL/USD daily chart
The digital asset was on the verge of a breakout, but got heavily rejected by the top trendline. A breakdown below the lower boundary at $0.18 which coincides with the 50 SMA would be a significant blow capable of pushing Zilliqa price down to $0.16 and eventually to $0.13.
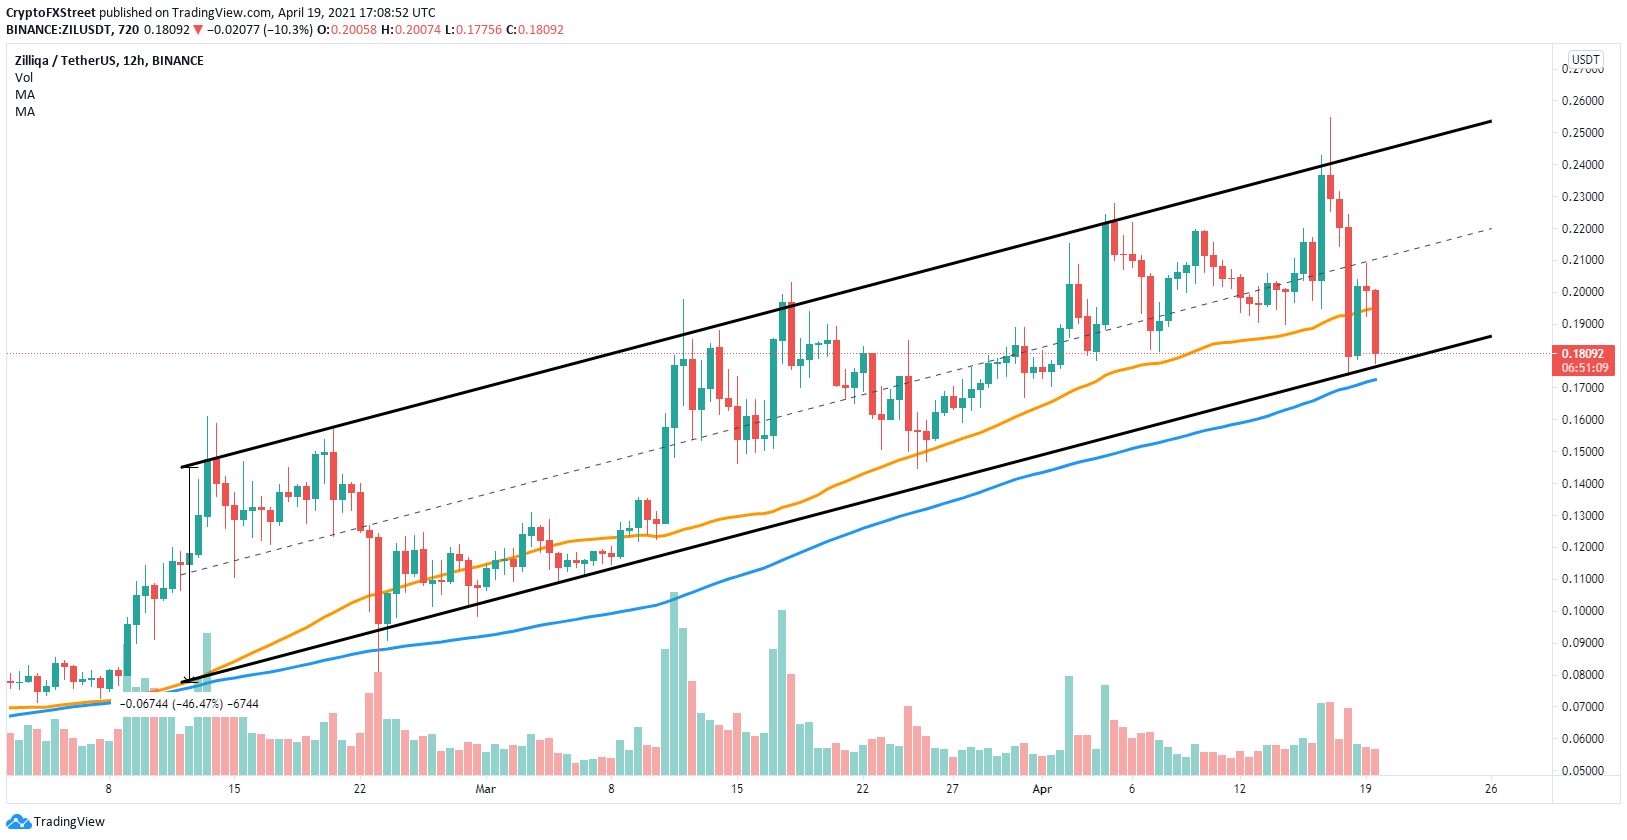
ZIL/USD 12-hour chart
On the other hand, if ZIL bulls can defend the lower trendline and push Zilliqa price above the 50 twelve-hour SMA, the digital asset could jump to $0.22 and up to $0.25.
