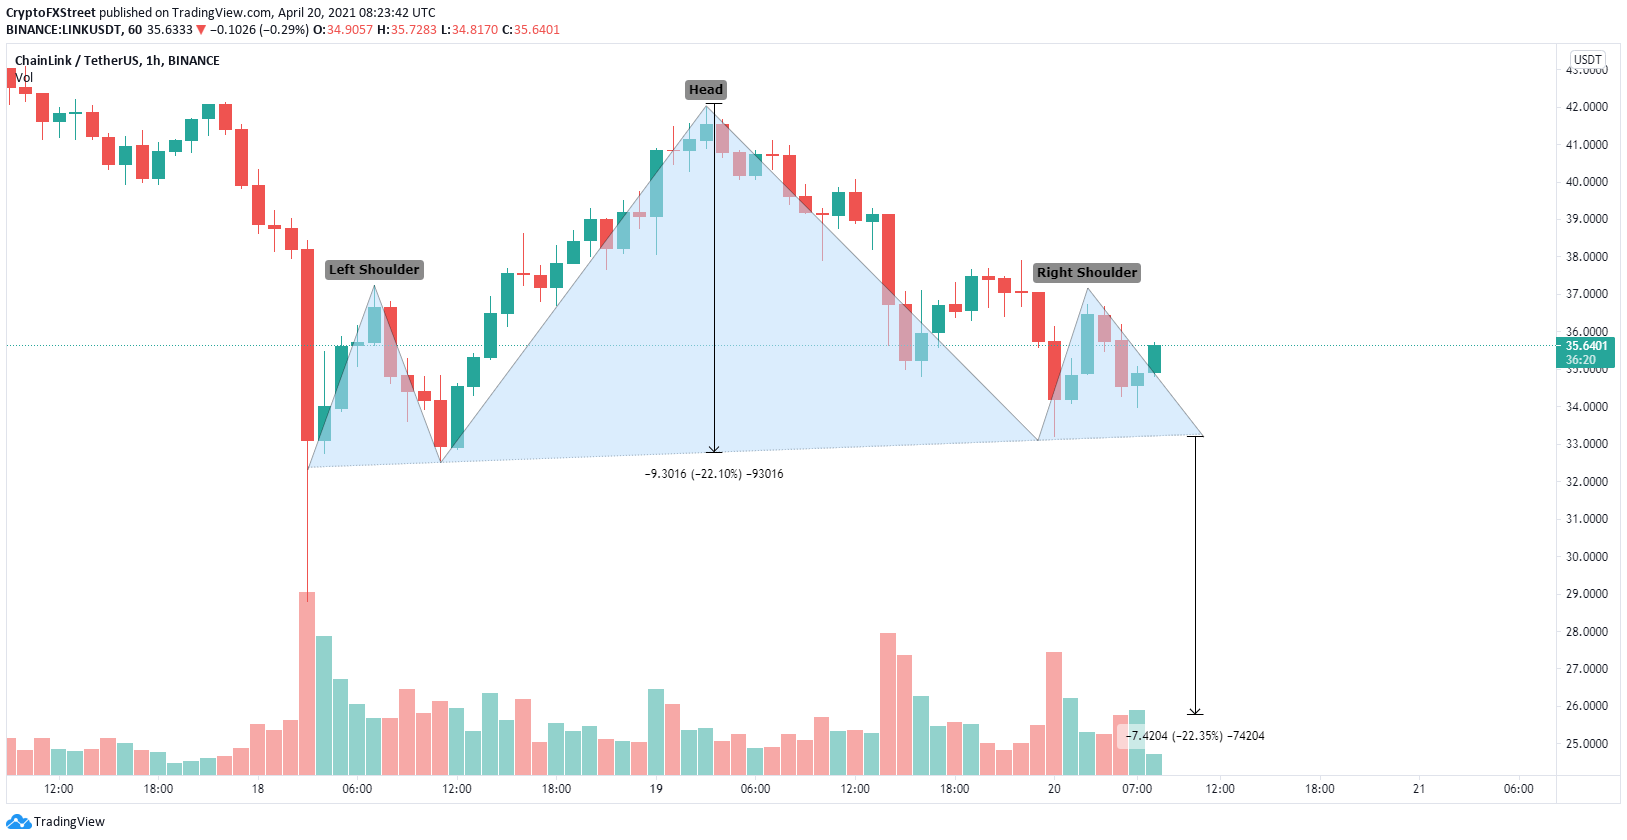
- Chainlink price has formed a head and shoulders pattern on the 1-hour chart.
- The number of whales holding LINK remains in an uptrend despite declining prices.
- LINK bulls must defend a key support level to avoid another drop.
Chainlink, like the rest of the market, has experienced a significant correction in the past four days However, the digital asset continues to hold above a crucial support level and on-chain metrics show it could be one of the strongest during this correction.
Chainlink price shows strength compared to other cryptocurrencies
One of the most notable on-chain metrics in favor of LINK is the number of whales, which continues to increase. This metric has been in an uptrend since March 2021. In the last three days, the number of whales holding between 100,000 and 1,000,000 LINK has increased by six.
LINK Supply Distribution
Additionally, the number of Chainlink coins inside exchanges also decreased significantly from a high of 15.7% of the total supply at the beginning of March to only 13.6% currently. Again, indicating that investors are not eager to sell LINK.
LINK Supply on Exchanges
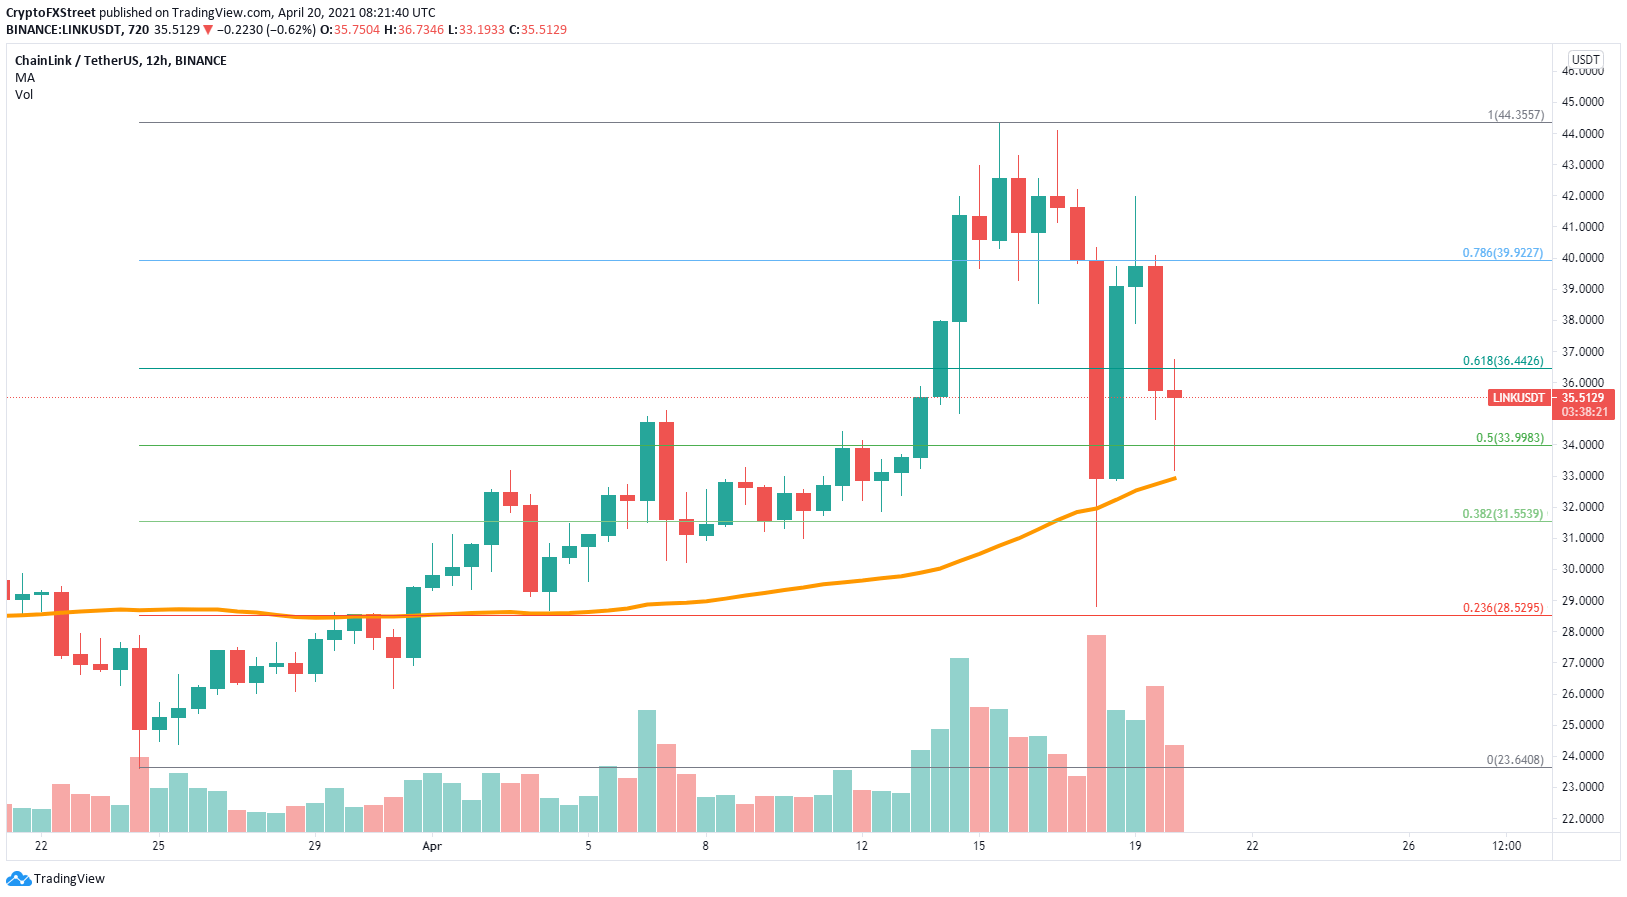
Chainlink has defended the 50 SMA at $33 on the daily chart and bounced above the 50% Fibonacci retracement level at $34. The next resistance level is located at $36.44 and then $40, also as potential price targets.
LINK/USD 12-hours chart
On the other hand, in the short-term, Chainlink established a head and shoulders pattern on the 1-hour chart. The neckline support is located at around $33.18.
LINK/USD 1-hour chart
A 1-hour close below $33.18 would confirm a breakdown below the head and shoulders pattern with a price target of $26 and an in-between target of $30, a psychological level.
%20%5B10.13.22,%2020%20Apr,%202021%5D-637545041413605102.png)
%20%5B10.13.18,%2020%20Apr,%202021%5D-637545041673678347.png)


