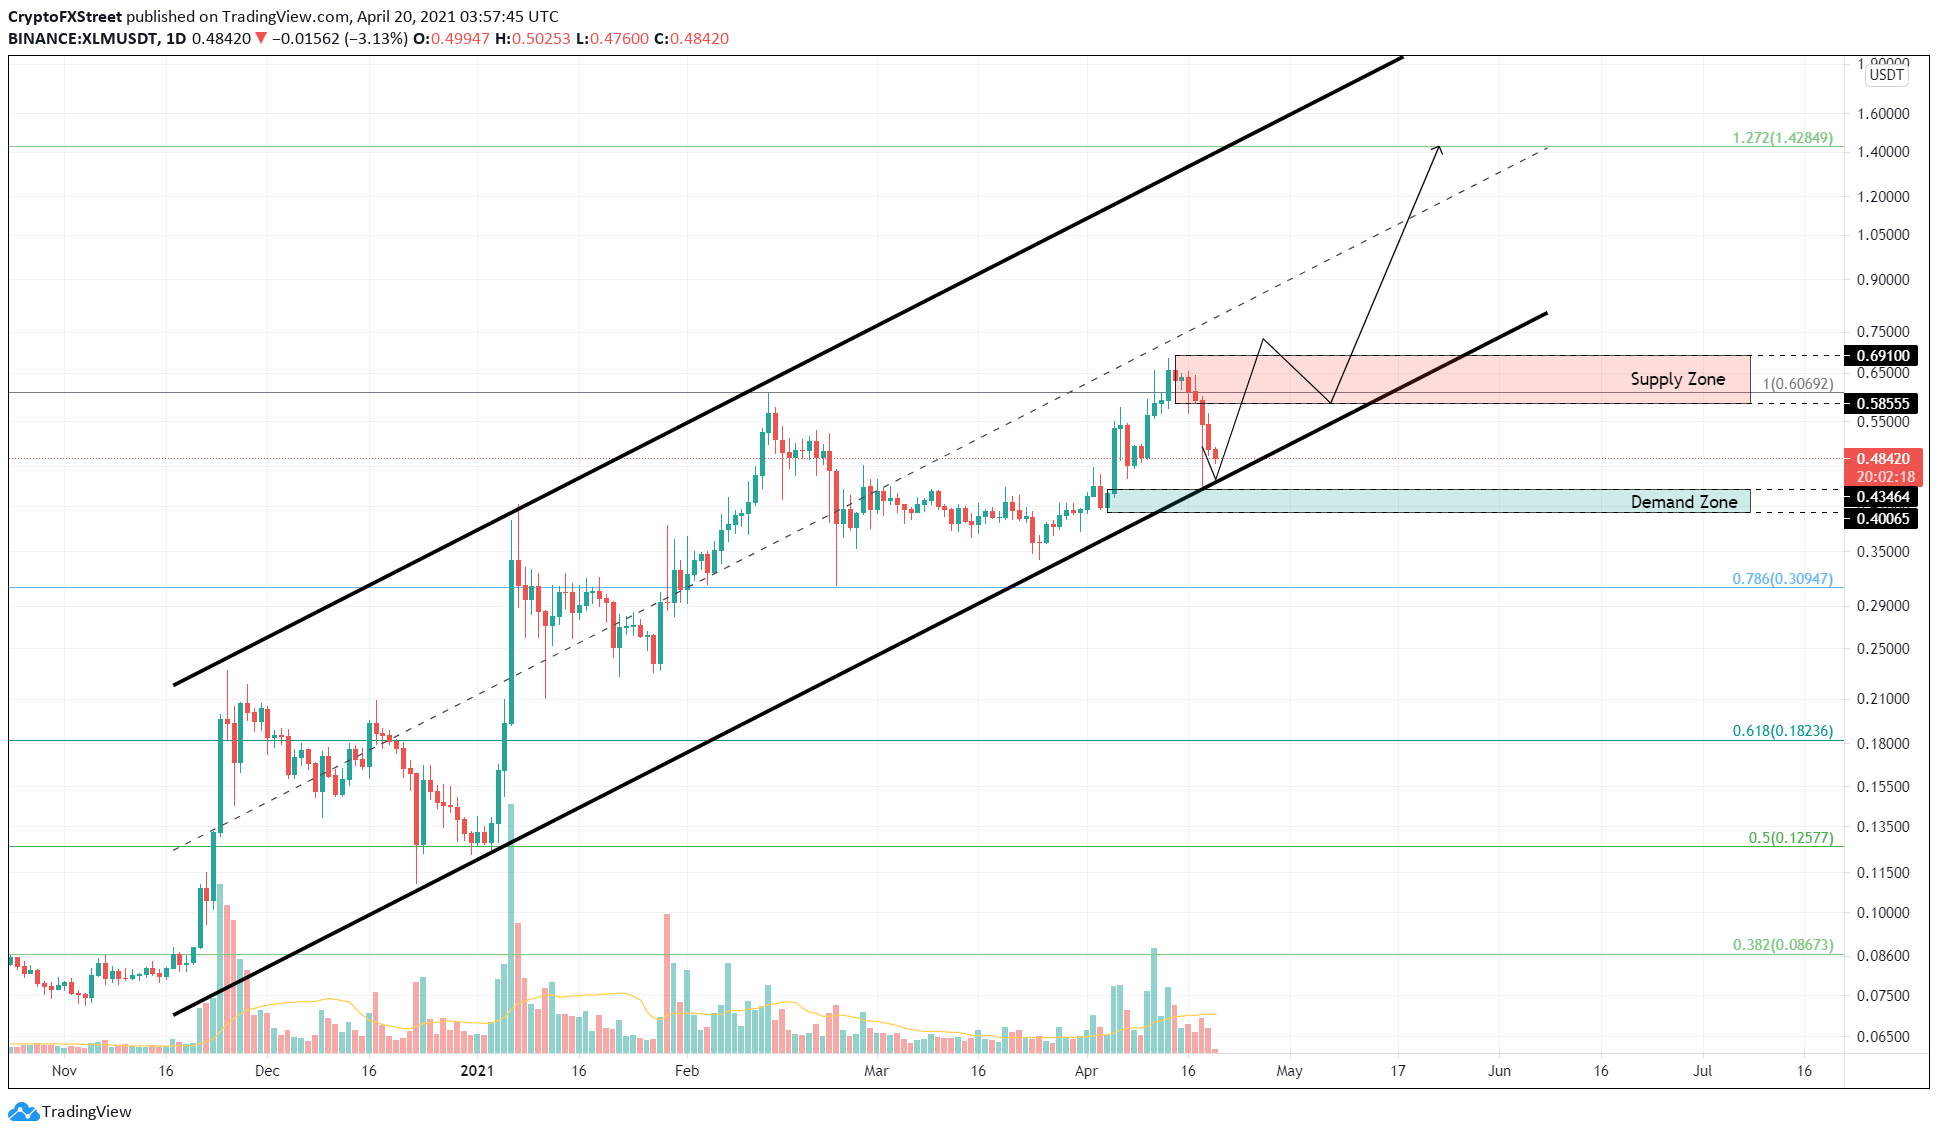
- XLM price is heading toward the lower trend line of an ascending parallel channel.
- A bounce from the demand zone extending from $0.40 to $0.43 can propel Stellar by 200% to record levels.
- If this area of support is breached, a bearish narrative will unfold.
XLM price has been in a downtrend for nearly a week. This move has brought Stellar closers to a potential launchpad that could catapult it higher.
XLM price at inflection point
On the 1-day chart, XLM price shows a 31% decline in the last six days, bringing it closer to a demand zone that stretches from $0.40 to $0.43. This area coincides with the lower trend line of an ascending parallel channel that has contained Stellar’s rally since late November 2020.
This setup is formed when the higher highs and higher lows of XLM price are connected using trend lines. Two of three swing lows have bounced from the lower boundary of this technical formation and extended toward the upper bounds.
Now, If something similar were to happen, Stellar could once again bounce from this support area and kick-start an upward move to the 127.2% Fibonacci extension level at $1.42.
However, this upswing will face substantial resistance from $0.58 to $0.69. Here, the previous rally faced reversal due to excessive selling pressure. Hence, XLM price needs to clear this range to have any chance of hitting $1.42, which is a 200% upswing from the current levels.
XLM/USDT 1-day chart
If the buyers cannot defend the said support zone and it results in a decisive close below $0.40, the bullish scenario will be threatened. However, if XLM price shatters $0.34, it would signify the start of a new downtrend.
In such a scenario, investors can expect Stellar to slide 9% to $0.30, which coincides with the 78.6% Fibonacci retracement level.

